
Houses for sale & to rent in East Riding of Yorkshire, England
House Prices in East Riding of Yorkshire
Properties in East Riding of Yorkshire have
an average house price of
£237,219.00
and had 19,154 Property Transactions
within the last 3 years.¹
East Riding of Yorkshire is a location in
England with
144,383 households², where the most expensive property was sold for £1,906,000.00.
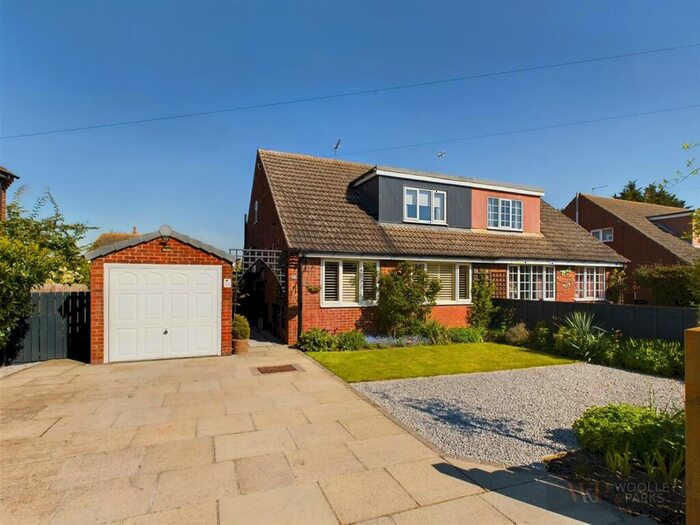
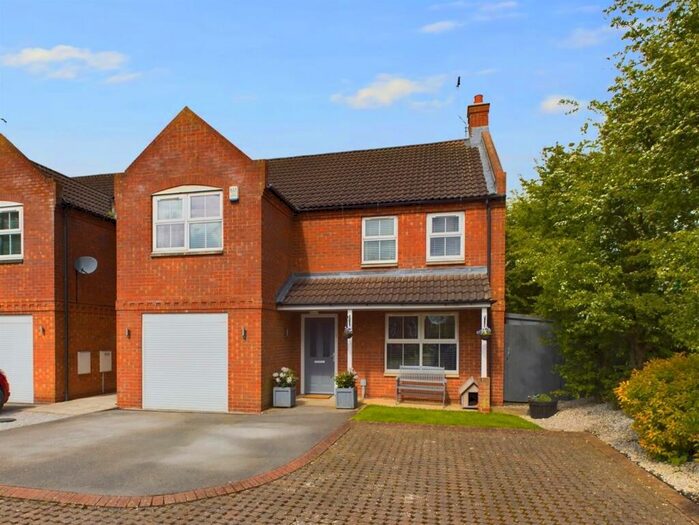
Properties for sale in East Riding of Yorkshire


Towns in East Riding of Yorkshire
Navigate through our locations to find the location of your next house in East Riding of Yorkshire, England for sale or to rent.
Transport in East Riding of Yorkshire
Please see below transportation links in this area:
-
 Beverley Station
 -
Arram Station
-
Cottingham Station
-
Hutton Cranswick Station
-
Hull Station
-
Hessle Station
-
Ferriby Station
-
Brough Station
- FAQ
- Price Paid By Year
- Property Type Price
Frequently asked questions about East Riding of Yorkshire
What is the average price for a property for sale in East Riding of Yorkshire?
The average price for a property for sale in East Riding of Yorkshire is £237,219. This amount is 40% lower than the average price in England. There are more than 10,000 property listings for sale in East Riding of Yorkshire.
What locations have the most expensive properties for sale in East Riding of Yorkshire?
The locations with the most expensive properties for sale in East Riding of Yorkshire are North Ferriby at an average of £373,351, Selby at an average of £359,575 and York at an average of £298,321.
What locations have the most affordable properties for sale in East Riding of Yorkshire?
The locations with the most affordable properties for sale in East Riding of Yorkshire are Withernsea at an average of £140,771, Bridlington at an average of £182,411 and Goole at an average of £194,459.
Which train stations are available in or near East Riding of Yorkshire?
Some of the train stations available in or near East Riding of Yorkshire are Beverley, Arram and Cottingham.
Property Price Paid in East Riding of Yorkshire by Year
The average sold property price by year was:
| Year | Average Sold Price | Price Change |
Sold Properties
|
|---|---|---|---|
| 2024 | £233,847 | -2% |
359 Properties |
| 2023 | £238,034 | -1% |
4,448 Properties |
| 2022 | £240,848 | 3% |
6,380 Properties |
| 2021 | £234,009 | 4% |
7,967 Properties |
| 2020 | £224,254 | 7% |
6,176 Properties |
| 2019 | £208,638 | 3% |
7,178 Properties |
| 2018 | £202,791 | 2% |
7,302 Properties |
| 2017 | £198,353 | 6% |
7,330 Properties |
| 2016 | £186,072 | 5% |
6,930 Properties |
| 2015 | £177,595 | 3% |
6,593 Properties |
| 2014 | £172,271 | 5% |
6,416 Properties |
| 2013 | £163,278 | 1% |
5,301 Properties |
| 2012 | £161,995 | -1% |
4,389 Properties |
| 2011 | £163,703 | -3% |
4,475 Properties |
| 2010 | £169,145 | 5% |
4,387 Properties |
| 2009 | £160,753 | -9% |
4,059 Properties |
| 2008 | £174,939 | 0,3% |
4,307 Properties |
| 2007 | £174,485 | 6% |
8,397 Properties |
| 2006 | £164,816 | 6% |
9,046 Properties |
| 2005 | £155,031 | 6% |
7,151 Properties |
| 2004 | £145,281 | 19% |
8,334 Properties |
| 2003 | £117,816 | 19% |
8,951 Properties |
| 2002 | £95,513 | 19% |
9,351 Properties |
| 2001 | £77,428 | 9% |
9,082 Properties |
| 2000 | £70,472 | 6% |
8,122 Properties |
| 1999 | £66,337 | 5% |
7,296 Properties |
| 1998 | £62,956 | 2% |
6,720 Properties |
| 1997 | £61,906 | 3% |
6,858 Properties |
| 1996 | £60,148 | 1% |
6,533 Properties |
| 1995 | £59,787 | - |
5,692 Properties |
Property Price per Property Type in East Riding of Yorkshire
Here you can find historic sold price data in order to help with your property search.
The average Property Paid Price for specific property types in the last three years are:
| Property Type | Average Sold Price | Sold Properties |
|---|---|---|
| Terraced House | £161,431.00 | 4,643 Terraced Houses |
| Flat | £121,487.00 | 1,322 Flats |
| Semi Detached House | £204,326.00 | 6,684 Semi Detached Houses |
| Detached House | £348,631.00 | 6,505 Detached Houses |