
Houses for sale & to rent in Hammersmith and Fulham London Borough, England
House Prices in Hammersmith and Fulham London Borough
Properties in Hammersmith and Fulham London Borough have
an average house price of
£989,982.00
and had 7,133 Property Transactions
within the last 3 years.¹
Hammersmith and Fulham London Borough is a location in
England with
80,543 households², where the most expensive property was sold for £9,300,000.00.
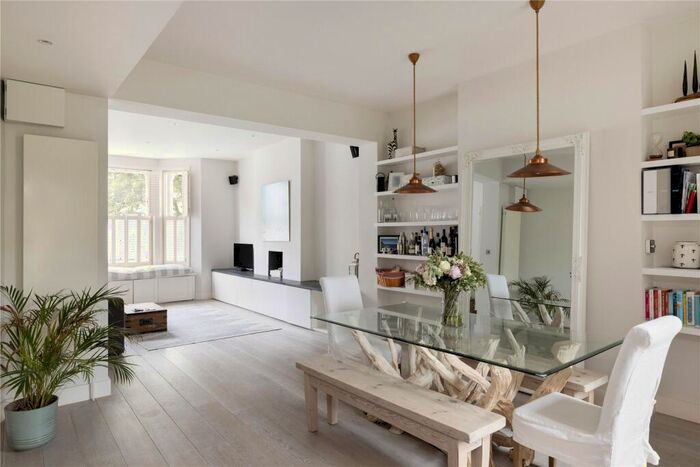
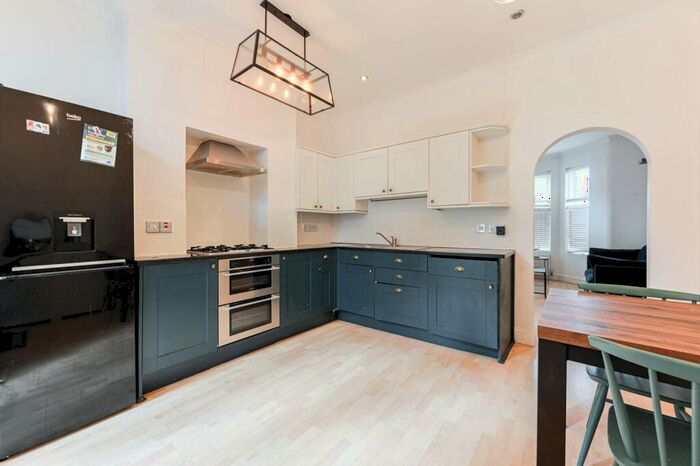
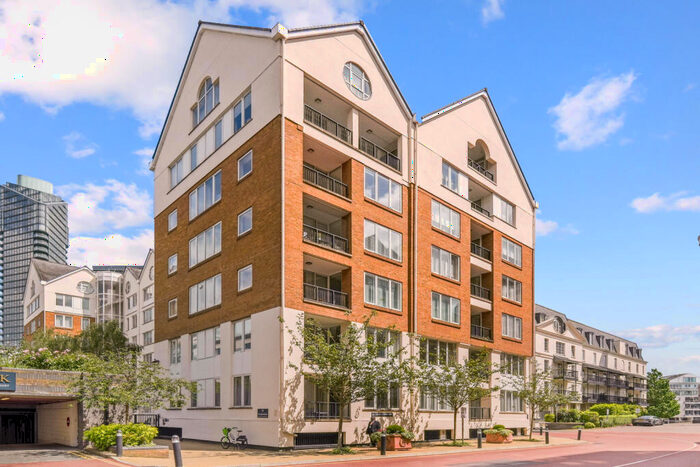
Properties for sale in Hammersmith and Fulham London Borough


Towns in Hammersmith and Fulham London Borough
Navigate through our locations to find the location of your next house in Hammersmith and Fulham, England for sale or to rent.
Transport in Hammersmith and Fulham London Borough
Please see below transportation links in this area:
-
 Barons Court Station
 -
Hammersmith (District) Station
-
West Kensington Station
-
Hammersmith (Met.) Station
-

 Kensington (Olympia) Station
 -
West Brompton Station
-
Ravenscourt Park Station
-
Earls Court Station
-
Goldhawk Road Station
-
Shepherds Bush Station
- FAQ
- Price Paid By Year
- Property Type Price
Frequently asked questions about Hammersmith and Fulham London Borough
What is the average price for a property for sale in Hammersmith and Fulham London Borough?
The average price for a property for sale in Hammersmith and Fulham London Borough is £989,982. This amount is 94% higher than the average price in England. There are more than 10,000 property listings for sale in Hammersmith and Fulham London Borough.
Which train stations are available in or near Hammersmith and Fulham London Borough?
Some of the train stations available in or near Hammersmith and Fulham London Borough are Kensington (Olympia), West Brompton and Shepherds Bush.
Which tube stations are available in or near Hammersmith and Fulham London Borough?
Some of the tube stations available in or near Hammersmith and Fulham London Borough are Barons Court, Hammersmith (District) and West Kensington.
Property Price Paid in Hammersmith and Fulham London Borough by Year
The average sold property price by year was:
| Year | Average Sold Price | Price Change |
Sold Properties
|
|---|---|---|---|
| 2024 | £919,204 | -9% |
90 Properties |
| 2023 | £1,000,259 | -0,4% |
1,682 Properties |
| 2022 | £1,004,743 | 3% |
2,428 Properties |
| 2021 | £974,040 | -1% |
2,933 Properties |
| 2020 | £980,496 | 7% |
2,273 Properties |
| 2019 | £914,939 | -8% |
2,195 Properties |
| 2018 | £985,924 | -0,4% |
2,511 Properties |
| 2017 | £990,358 | 6% |
2,430 Properties |
| 2016 | £930,895 | -1% |
2,488 Properties |
| 2015 | £938,813 | 6% |
2,741 Properties |
| 2014 | £881,237 | 13% |
3,038 Properties |
| 2013 | £763,447 | 12% |
3,076 Properties |
| 2012 | £674,813 | 6% |
2,637 Properties |
| 2011 | £637,573 | 3% |
2,725 Properties |
| 2010 | £621,612 | 11% |
2,517 Properties |
| 2009 | £554,177 | -2% |
1,955 Properties |
| 2008 | £564,786 | 5% |
1,668 Properties |
| 2007 | £534,956 | 15% |
3,867 Properties |
| 2006 | £452,957 | 8% |
4,192 Properties |
| 2005 | £417,904 | 7% |
3,259 Properties |
| 2004 | £386,817 | 8% |
3,673 Properties |
| 2003 | £357,110 | 3% |
3,371 Properties |
| 2002 | £345,547 | 11% |
4,089 Properties |
| 2001 | £306,713 | 8% |
3,703 Properties |
| 2000 | £281,007 | 14% |
3,672 Properties |
| 1999 | £240,680 | 18% |
4,361 Properties |
| 1998 | £196,883 | 11% |
3,613 Properties |
| 1997 | £176,197 | 15% |
4,267 Properties |
| 1996 | £150,247 | 8% |
4,017 Properties |
| 1995 | £138,043 | - |
3,049 Properties |
Property Price per Property Type in Hammersmith and Fulham London Borough
Here you can find historic sold price data in order to help with your property search.
The average Property Paid Price for specific property types in the last three years are:
| Property Type | Average Sold Price | Sold Properties |
|---|---|---|
| Terraced House | £1,558,661.00 | 2,187 Terraced Houses |
| Flat | £685,938.00 | 4,776 Flats |
| Semi Detached House | £2,118,054.00 | 141 Semi Detached Houses |
| Detached House | £2,691,858.00 | 29 Detached Houses |