
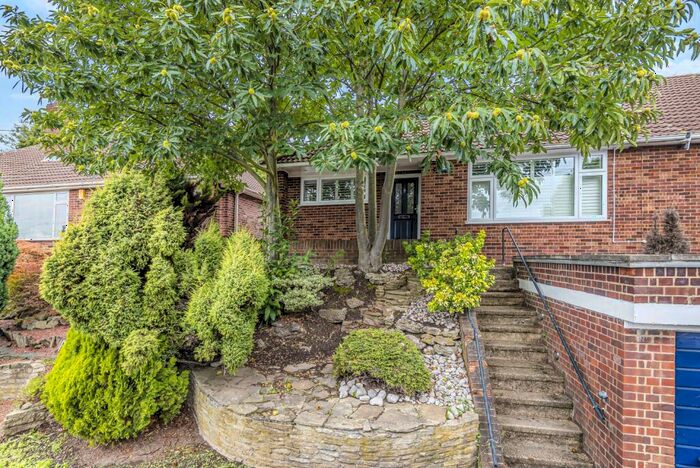
Houses for sale & to rent in Bexleyheath, Bexley London Borough
House Prices in Bexleyheath
Properties in this part of Bexleyheath within the Bexley London Borough have an average house price of £444,652.00 and had 2,046 Property Transactions within the last 3 years.¹ This area has 18,009 households² , where the most expensive property was sold for £1,350,000.00.
Properties for sale in Bexleyheath


Neighbourhoods in Bexleyheath
Navigate through our locations to find the location of your next house in Bexleyheath, Bexley London Borough for sale or to rent.
Transport in Bexleyheath
Please see below transportation links in this area:
-
 Bexleyheath Station
 -
Barnehurst Station
-
Bexley Station
-
Crayford Station
-
Welling Station
-
Erith Station
-
Albany Park Station
-
Slade Green Station
-
Belvedere Station
-
 Abbey Wood Station
- FAQ
- Price Paid By Year
- Property Type Price
Frequently asked questions about Bexleyheath
What is the average price for a property for sale in Bexleyheath?
The average price for a property for sale in Bexleyheath is £444,652. This amount is 7% higher than the average price in Bexley London Borough. There are 7,119 property listings for sale in Bexleyheath.
What locations have the most expensive properties for sale in Bexleyheath?
The locations with the most expensive properties for sale in Bexleyheath are St Michaels at an average of £510,401, Northumberland Heath at an average of £505,473 and Brampton at an average of £486,143.
What locations have the most affordable properties for sale in Bexleyheath?
The locations with the most affordable properties for sale in Bexleyheath are North End at an average of £268,252, Bexleyheath at an average of £269,152 and Barnehurst at an average of £413,350.
Which train stations are available in or near Bexleyheath?
Some of the train stations available in or near Bexleyheath are Bexleyheath, Barnehurst and Bexley.
Property Price Paid in Bexleyheath by Year
The average sold property price by year was:
| Year | Average Sold Price | Price Change |
Sold Properties
|
|---|---|---|---|
| 2024 | £381,345 | -20% |
23 Properties |
| 2023 | £456,874 | -2% |
486 Properties |
| 2022 | £463,886 | 9% |
677 Properties |
| 2021 | £424,297 | 3% |
860 Properties |
| 2020 | £410,618 | 6% |
593 Properties |
| 2019 | £387,370 | 0,1% |
623 Properties |
| 2018 | £386,796 | 3% |
695 Properties |
| 2017 | £375,093 | 4% |
754 Properties |
| 2016 | £359,915 | 13% |
701 Properties |
| 2015 | £314,483 | 9% |
819 Properties |
| 2014 | £284,864 | 11% |
803 Properties |
| 2013 | £252,898 | 5% |
690 Properties |
| 2012 | £240,844 | 0,2% |
553 Properties |
| 2011 | £240,443 | 2% |
559 Properties |
| 2010 | £234,466 | 8% |
523 Properties |
| 2009 | £215,584 | -10% |
484 Properties |
| 2008 | £236,397 | -2% |
533 Properties |
| 2007 | £240,466 | 6% |
950 Properties |
| 2006 | £226,066 | 7% |
952 Properties |
| 2005 | £209,539 | 2% |
755 Properties |
| 2004 | £205,501 | 6% |
938 Properties |
| 2003 | £194,177 | 12% |
818 Properties |
| 2002 | £170,719 | 19% |
993 Properties |
| 2001 | £138,104 | 12% |
952 Properties |
| 2000 | £121,794 | 12% |
792 Properties |
| 1999 | £106,606 | 11% |
944 Properties |
| 1998 | £94,719 | 13% |
747 Properties |
| 1997 | £82,680 | 8% |
936 Properties |
| 1996 | £75,727 | 4% |
811 Properties |
| 1995 | £72,416 | - |
711 Properties |
Property Price per Property Type in Bexleyheath
Here you can find historic sold price data in order to help with your property search.
The average Property Paid Price for specific property types in the last three years are:
| Property Type | Average Sold Price | Sold Properties |
|---|---|---|
| Terraced House | £432,151.00 | 496 Terraced Houses |
| Flat | £265,734.00 | 412 Flats |
| Semi Detached House | £497,516.00 | 988 Semi Detached Houses |
| Detached House | £629,220.00 | 150 Detached Houses |