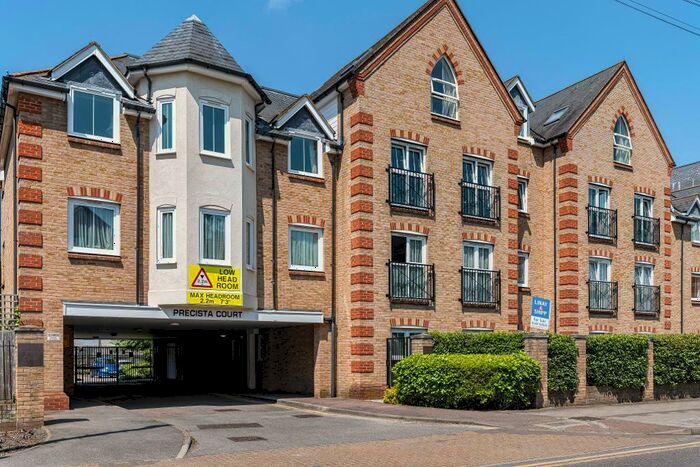
Houses for sale & to rent in Orpington, Bromley London Borough
House Prices in Orpington
Properties in this part of Orpington within the Bromley London Borough have an average house price of £560,365.00 and had 4,130 Property Transactions within the last 3 years.¹ This area has 37,804 households² , where the most expensive property was sold for £15,375,000.00.
Properties for sale in Orpington
Neighbourhoods in Orpington
Navigate through our locations to find the location of your next house in Orpington, Bromley London Borough for sale or to rent.
Transport in Orpington
Please see below transportation links in this area:
-
Orpington Station
-
Petts Wood Station
-
St.Mary Cray Station
-
St Mary Cray Station
-
Chelsfield Station
-
Chislehurst Station
-
Knockholt Station
-
Bickley Station
- FAQ
- Price Paid By Year
- Property Type Price
Frequently asked questions about Orpington
What is the average price for a property for sale in Orpington?
The average price for a property for sale in Orpington is £560,365. This amount is 0.84% lower than the average price in Bromley London Borough. There are more than 10,000 property listings for sale in Orpington.
What locations have the most expensive properties for sale in Orpington?
The locations with the most expensive properties for sale in Orpington are Bromley Common And Keston at an average of £4,424,742, Chislehurst at an average of £973,400 and Petts Wood And Knoll at an average of £728,549.
What locations have the most affordable properties for sale in Orpington?
The locations with the most affordable properties for sale in Orpington are Cray Valley East at an average of £380,036, Cray Valley West at an average of £440,106 and Orpington at an average of £527,059.
Which train stations are available in or near Orpington?
Some of the train stations available in or near Orpington are Orpington, Petts Wood and St.Mary Cray.
Property Price Paid in Orpington by Year
The average sold property price by year was:
| Year | Average Sold Price | Price Change |
Sold Properties
|
|---|---|---|---|
| 2024 | £492,637 | -15% |
65 Properties |
| 2023 | £565,848 | -4% |
942 Properties |
| 2022 | £589,376 | 9% |
1,336 Properties |
| 2021 | £538,249 | 8% |
1,787 Properties |
| 2020 | £495,778 | 6% |
1,302 Properties |
| 2019 | £463,744 | -2% |
1,335 Properties |
| 2018 | £471,209 | 1% |
1,398 Properties |
| 2017 | £466,224 | 5% |
1,376 Properties |
| 2016 | £440,610 | 4% |
1,469 Properties |
| 2015 | £422,142 | 9% |
1,616 Properties |
| 2014 | £383,065 | 11% |
1,576 Properties |
| 2013 | £340,891 | 8% |
1,405 Properties |
| 2012 | £315,120 | -4% |
1,183 Properties |
| 2011 | £327,248 | 4% |
1,033 Properties |
| 2010 | £313,062 | 11% |
1,176 Properties |
| 2009 | £279,886 | -5% |
1,033 Properties |
| 2008 | £292,936 | -3% |
948 Properties |
| 2007 | £300,694 | 9% |
2,004 Properties |
| 2006 | £272,491 | 2% |
2,163 Properties |
| 2005 | £267,499 | 4% |
1,580 Properties |
| 2004 | £257,452 | 11% |
1,796 Properties |
| 2003 | £228,646 | 9% |
1,801 Properties |
| 2002 | £207,143 | 14% |
2,107 Properties |
| 2001 | £179,061 | 9% |
1,917 Properties |
| 2000 | £162,527 | 12% |
1,586 Properties |
| 1999 | £142,494 | 10% |
1,649 Properties |
| 1998 | £127,575 | 13% |
1,396 Properties |
| 1997 | £111,553 | 8% |
2,048 Properties |
| 1996 | £102,416 | 6% |
1,758 Properties |
| 1995 | £96,185 | - |
1,378 Properties |
Property Price per Property Type in Orpington
Here you can find historic sold price data in order to help with your property search.
The average Property Paid Price for specific property types in the last three years are:
| Property Type | Average Sold Price | Sold Properties |
|---|---|---|
| Terraced House | £408,901.00 | 954 Terraced Houses |
| Flat | £276,548.00 | 573 Flats |
| Semi Detached House | £556,767.00 | 1,746 Semi Detached Houses |
| Detached House | £926,065.00 | 857 Detached Houses |


