
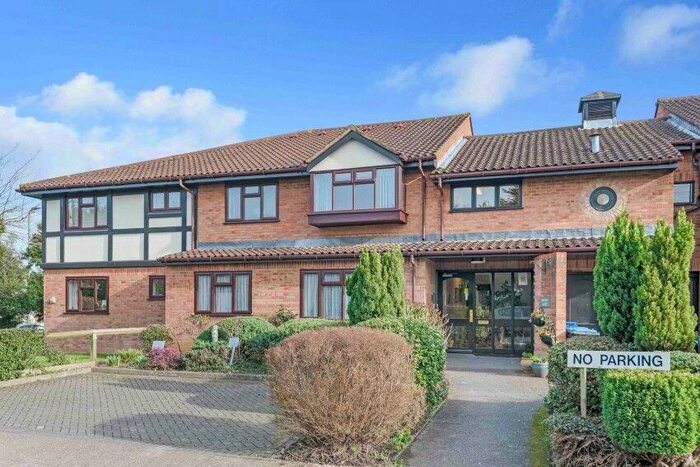
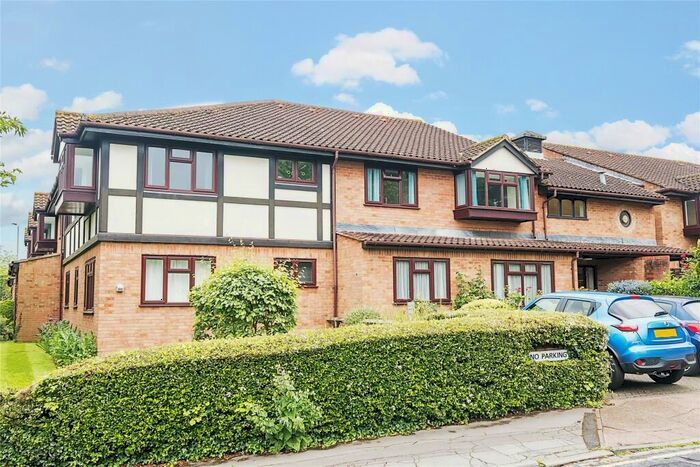
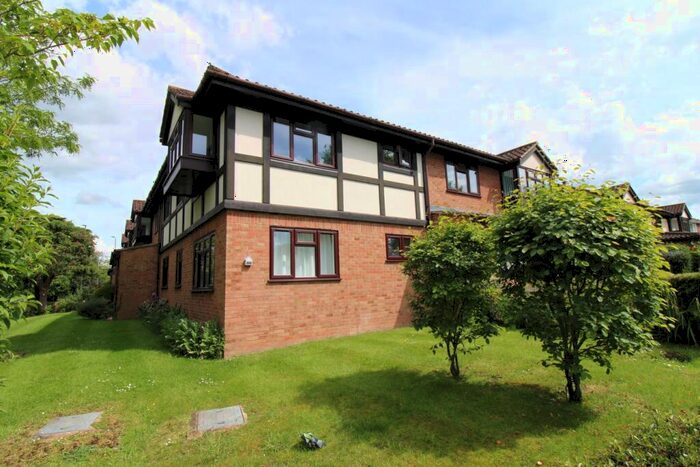
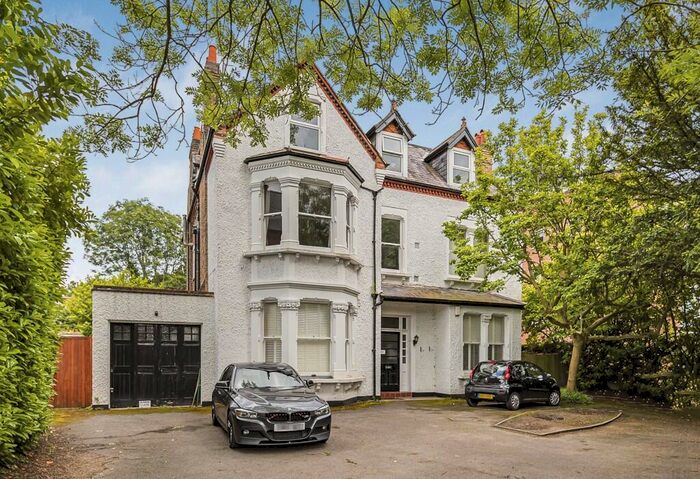
Houses for sale & to rent in West Wickham, Bromley London Borough
House Prices in West Wickham
Properties in this part of West Wickham within the Bromley London Borough have an average house price of £633,707.00 and had 730 Property Transactions within the last 3 years.¹ This area has 7,384 households² , where the most expensive property was sold for £1,500,000.00.
Properties for sale in West Wickham


Neighbourhoods in West Wickham
Navigate through our locations to find the location of your next house in West Wickham, Bromley London Borough for sale or to rent.
Transport in West Wickham
Please see below transportation links in this area:
-
 West Wickham Station
 -
Hayes Station
-
Hayes (Kent) Station
-
Eden Park Station
-
 Addington Village Station
 -
Fieldway Station
-
Bromley South Station
-
Gravel Hill Station
-
King Henry's Drive Station
-
Shortlands Station
- FAQ
- Price Paid By Year
- Property Type Price
Frequently asked questions about West Wickham
What is the average price for a property for sale in West Wickham?
The average price for a property for sale in West Wickham is £633,707. This amount is 11% higher than the average price in Bromley London Borough. There are 2,841 property listings for sale in West Wickham.
What locations have the most expensive properties for sale in West Wickham?
The locations with the most expensive properties for sale in West Wickham are Shortlands at an average of £732,333 and West Wickham at an average of £636,591.
What locations have the most affordable properties for sale in West Wickham?
The location with the most affordable properties for sale in West Wickham is Hayes And Coney Hall at an average of £624,807.
Which train stations are available in or near West Wickham?
Some of the train stations available in or near West Wickham are West Wickham, Hayes and Hayes (Kent).
Property Price Paid in West Wickham by Year
The average sold property price by year was:
| Year | Average Sold Price | Price Change |
Sold Properties
|
|---|---|---|---|
| 2024 | £582,100 | -9% |
5 Properties |
| 2023 | £635,612 | -3% |
156 Properties |
| 2022 | £653,212 | 5% |
244 Properties |
| 2021 | £618,944 | 7% |
325 Properties |
| 2020 | £576,215 | 6% |
233 Properties |
| 2019 | £543,081 | 2% |
254 Properties |
| 2018 | £531,710 | -3% |
231 Properties |
| 2017 | £545,695 | 6% |
264 Properties |
| 2016 | £510,525 | 7% |
306 Properties |
| 2015 | £476,247 | 6% |
294 Properties |
| 2014 | £448,814 | 16% |
254 Properties |
| 2013 | £378,468 | -1% |
266 Properties |
| 2012 | £381,024 | 8% |
244 Properties |
| 2011 | £349,164 | 2% |
262 Properties |
| 2010 | £342,487 | 8% |
274 Properties |
| 2009 | £314,675 | 2% |
222 Properties |
| 2008 | £309,806 | -14% |
232 Properties |
| 2007 | £352,935 | 7% |
355 Properties |
| 2006 | £328,688 | 11% |
403 Properties |
| 2005 | £293,093 | 0,5% |
291 Properties |
| 2004 | £291,681 | 11% |
368 Properties |
| 2003 | £259,544 | 9% |
324 Properties |
| 2002 | £236,411 | 12% |
414 Properties |
| 2001 | £207,014 | 11% |
357 Properties |
| 2000 | £184,711 | 15% |
270 Properties |
| 1999 | £156,441 | 12% |
370 Properties |
| 1998 | £137,121 | 13% |
332 Properties |
| 1997 | £119,005 | 14% |
347 Properties |
| 1996 | £102,797 | -0,3% |
291 Properties |
| 1995 | £103,143 | - |
241 Properties |
Property Price per Property Type in West Wickham
Here you can find historic sold price data in order to help with your property search.
The average Property Paid Price for specific property types in the last three years are:
| Property Type | Average Sold Price | Sold Properties |
|---|---|---|
| Semi Detached House | £680,907.00 | 389 Semi Detached Houses |
| Detached House | £855,703.00 | 117 Detached Houses |
| Flat | £262,864.00 | 105 Flats |
| Terraced House | £588,366.00 | 119 Terraced Houses |