
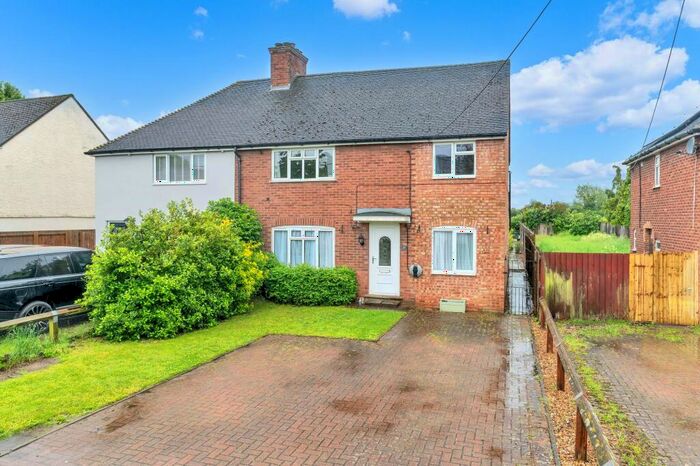
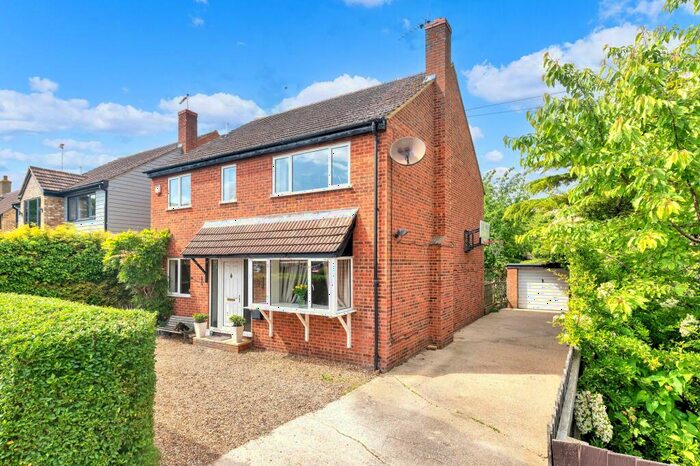
Houses for sale & to rent in Royston, Cambridgeshire
House Prices in Royston
Properties in Royston have an average house price of £519,028.00 and had 868 Property Transactions within the last 3 years.¹
Royston is an area in Cambridgeshire with 7,692 households², where the most expensive property was sold for £2,500,000.00.
Properties for sale in Royston


Neighbourhoods in Royston
Navigate through our locations to find the location of your next house in Royston, Cambridgeshire for sale or to rent.
Transport in Royston
Please see below transportation links in this area:

- FAQ
- Price Paid By Year
- Property Type Price
Frequently asked questions about Royston
What is the average price for a property for sale in Royston?
The average price for a property for sale in Royston is £519,028. This amount is 30% higher than the average price in Cambridgeshire. There are 7,893 property listings for sale in Royston.
What locations have the most expensive properties for sale in Royston?
The locations with the most expensive properties for sale in Royston are Caldecote at an average of £925,000, Whittlesford at an average of £888,875 and The Mordens at an average of £592,269.
What locations have the most affordable properties for sale in Royston?
The locations with the most affordable properties for sale in Royston are Foxton at an average of £402,500, Bassingbourn at an average of £466,764 and Melbourn at an average of £479,019.
Which train stations are available in or near Royston?
Some of the train stations available in or near Royston are Meldreth, Royston and Shepreth.
Property Price Paid in Royston by Year
The average sold property price by year was:
| Year | Average Sold Price | Price Change |
Sold Properties
|
|---|---|---|---|
| 2024 | £603,642 | 13% |
14 Properties |
| 2023 | £526,802 | -6% |
169 Properties |
| 2022 | £556,604 | 12% |
277 Properties |
| 2021 | £487,393 | -2% |
408 Properties |
| 2020 | £495,556 | 2% |
243 Properties |
| 2019 | £486,349 | 4% |
244 Properties |
| 2018 | £466,205 | 1% |
233 Properties |
| 2017 | £461,280 | 8% |
253 Properties |
| 2016 | £422,624 | -5% |
287 Properties |
| 2015 | £444,904 | 21% |
252 Properties |
| 2014 | £350,206 | 8% |
307 Properties |
| 2013 | £322,219 | -3% |
258 Properties |
| 2012 | £331,203 | -2% |
212 Properties |
| 2011 | £339,184 | 10% |
209 Properties |
| 2010 | £304,515 | 1% |
254 Properties |
| 2009 | £301,243 | -12% |
218 Properties |
| 2008 | £335,939 | 0,4% |
192 Properties |
| 2007 | £334,561 | 8% |
339 Properties |
| 2006 | £308,169 | 15% |
399 Properties |
| 2005 | £261,067 | -10% |
285 Properties |
| 2004 | £286,634 | 9% |
308 Properties |
| 2003 | £260,498 | 15% |
300 Properties |
| 2002 | £222,307 | 21% |
414 Properties |
| 2001 | £176,505 | 4% |
325 Properties |
| 2000 | £169,510 | 16% |
289 Properties |
| 1999 | £142,846 | 4% |
423 Properties |
| 1998 | £137,444 | 15% |
315 Properties |
| 1997 | £116,641 | 8% |
386 Properties |
| 1996 | £107,824 | 2% |
323 Properties |
| 1995 | £105,775 | - |
275 Properties |
Property Price per Property Type in Royston
Here you can find historic sold price data in order to help with your property search.
The average Property Paid Price for specific property types in the last three years are:
| Property Type | Average Sold Price | Sold Properties |
|---|---|---|
| Semi Detached House | £408,830.00 | 243 Semi Detached Houses |
| Terraced House | £322,562.00 | 164 Terraced Houses |
| Detached House | £680,327.00 | 427 Detached Houses |
| Flat | £228,542.00 | 34 Flats |