
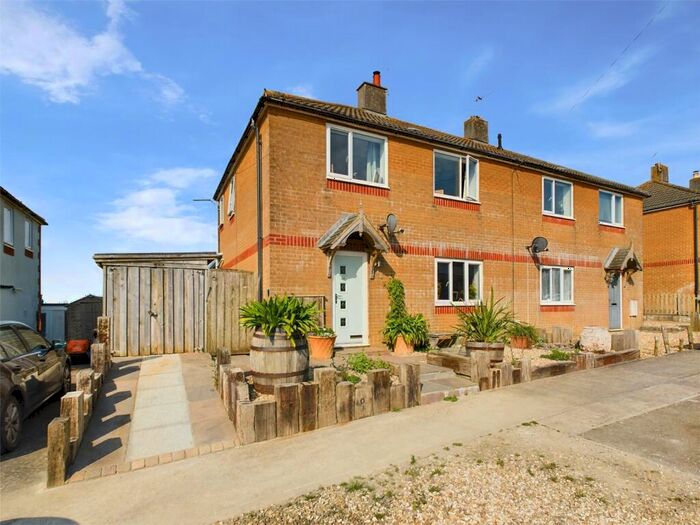
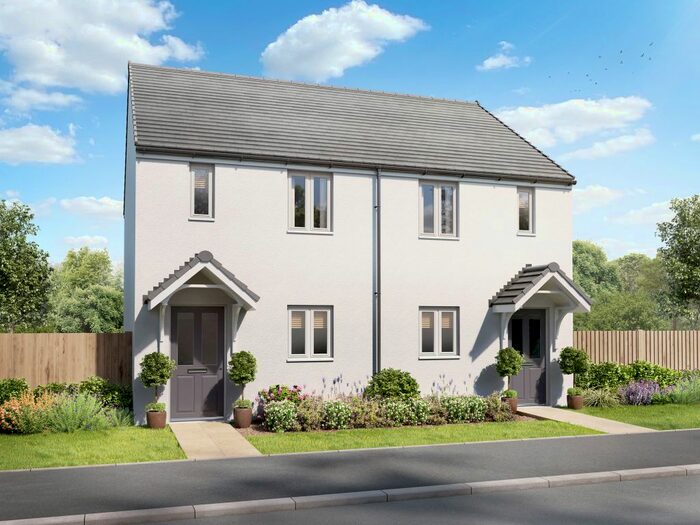
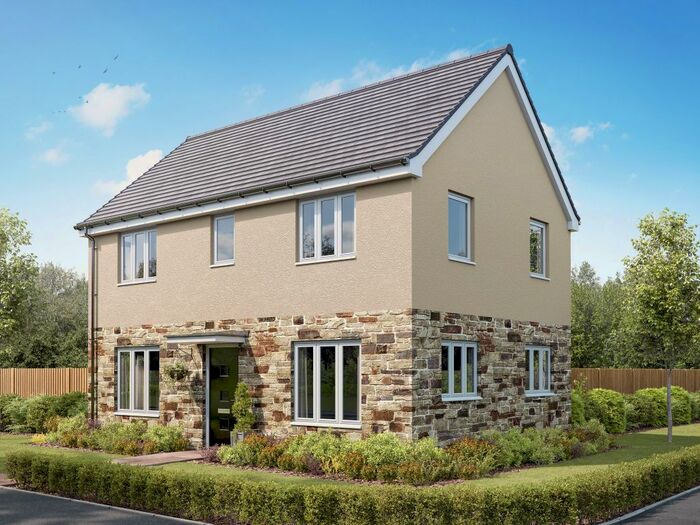
Houses for sale & to rent in Newquay, Cornwall
House Prices in Newquay
Properties in Newquay have an average house price of £366,071.00 and had 1,974 Property Transactions within the last 3 years.¹
Newquay is an area in Cornwall with 12,133 households², where the most expensive property was sold for £4,000,000.00.
Properties for sale in Newquay


Neighbourhoods in Newquay
Navigate through our locations to find the location of your next house in Newquay, Cornwall for sale or to rent.
- Ladock, St Clement And St Erme
- Newlyn And Goonhavern
- Newquay Central
- Newquay Pentire
- Newquay Treloggan
- Newquay Tretherras
- Newquay Treviglas
- Perranporth
- St Columb Major
- St Enoder
- St Mawgan And Colan
- Newquay Porth & Tretherras
- Newquay Central & Pentire
- Newquay Trenance
- St Columb Minor & Colan
- St Columb Major, St Mawgan & St Wenn
- St Newlyn East, Cubert & Goonhavern
Transport in Newquay
Please see below transportation links in this area:

- FAQ
- Price Paid By Year
- Property Type Price
Frequently asked questions about Newquay
What is the average price for a property for sale in Newquay?
The average price for a property for sale in Newquay is £366,071. This amount is 6% higher than the average price in Cornwall. There are 7,296 property listings for sale in Newquay.
What locations have the most expensive properties for sale in Newquay?
The locations with the most expensive properties for sale in Newquay are Perranporth at an average of £1,400,000, Newlyn And Goonhavern at an average of £421,935 and St Enoder at an average of £416,538.
What locations have the most affordable properties for sale in Newquay?
The locations with the most affordable properties for sale in Newquay are St Columb Major at an average of £141,285, Newquay Central at an average of £287,338 and Newquay Treloggan at an average of £302,995.
Which train stations are available in or near Newquay?
Some of the train stations available in or near Newquay are Newquay, Quintrell Downs and St.Columb Road.
Property Price Paid in Newquay by Year
The average sold property price by year was:
| Year | Average Sold Price | Price Change |
Sold Properties
|
|---|---|---|---|
| 2024 | £332,808 | -10% |
47 Properties |
| 2023 | £365,898 | -5% |
459 Properties |
| 2022 | £383,749 | 8% |
632 Properties |
| 2021 | £354,672 | 10% |
836 Properties |
| 2020 | £319,314 | 12% |
781 Properties |
| 2019 | £281,832 | 4% |
832 Properties |
| 2018 | £269,643 | 5% |
935 Properties |
| 2017 | £256,420 | 4% |
835 Properties |
| 2016 | £246,306 | 5% |
914 Properties |
| 2015 | £235,155 | 4% |
780 Properties |
| 2014 | £225,389 | 8% |
808 Properties |
| 2013 | £208,339 | -2% |
612 Properties |
| 2012 | £212,656 | -2% |
507 Properties |
| 2011 | £217,938 | -8% |
501 Properties |
| 2010 | £235,039 | 8% |
450 Properties |
| 2009 | £216,176 | -3% |
431 Properties |
| 2008 | £222,146 | -9% |
408 Properties |
| 2007 | £241,340 | 12% |
774 Properties |
| 2006 | £213,574 | 2% |
781 Properties |
| 2005 | £209,167 | 8% |
621 Properties |
| 2004 | £193,145 | 17% |
830 Properties |
| 2003 | £159,507 | 16% |
791 Properties |
| 2002 | £133,286 | 20% |
802 Properties |
| 2001 | £106,454 | 18% |
762 Properties |
| 2000 | £86,803 | 7% |
758 Properties |
| 1999 | £80,372 | 13% |
798 Properties |
| 1998 | £69,916 | 9% |
644 Properties |
| 1997 | £63,360 | 4% |
641 Properties |
| 1996 | £60,702 | 9% |
649 Properties |
| 1995 | £54,979 | - |
442 Properties |
Property Price per Property Type in Newquay
Here you can find historic sold price data in order to help with your property search.
The average Property Paid Price for specific property types in the last three years are:
| Property Type | Average Sold Price | Sold Properties |
|---|---|---|
| Terraced House | £301,702.00 | 515 Terraced Houses |
| Flat | £254,073.00 | 545 Flats |
| Semi Detached House | £340,197.00 | 350 Semi Detached Houses |
| Detached House | £549,129.00 | 564 Detached Houses |