
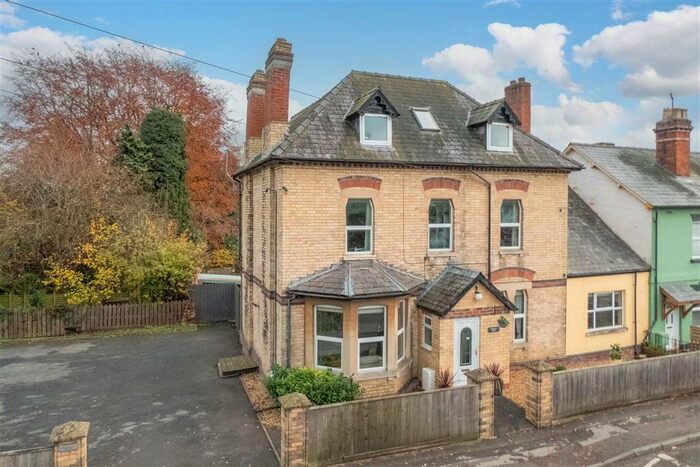
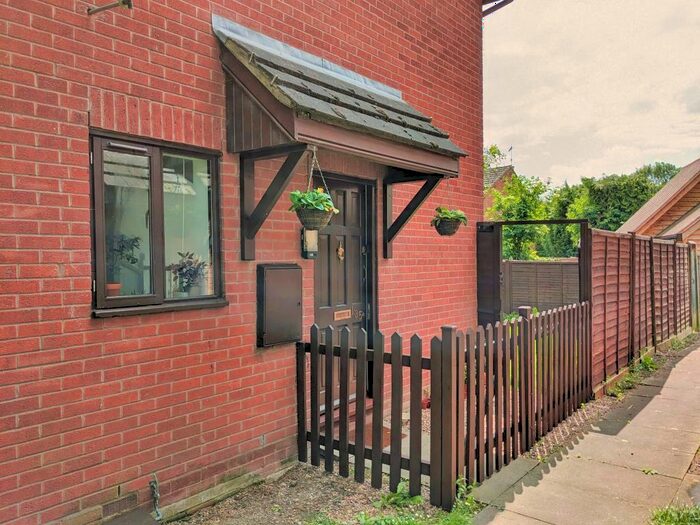
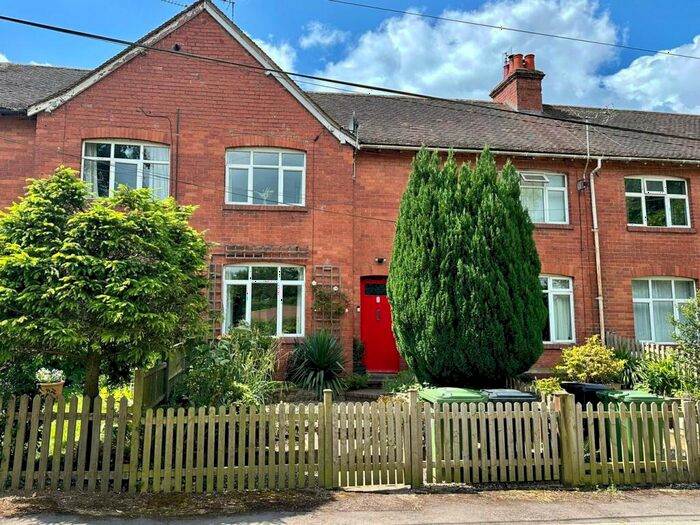
Houses for sale & to rent in Leominster, County of Herefordshire
House Prices in Leominster
Properties in Leominster have an average house price of £299,347.00 and had 1,008 Property Transactions within the last 3 years.¹
Leominster is an area in County of Herefordshire with 8,854 households², where the most expensive property was sold for £1,375,000.00.
Properties for sale in Leominster


Neighbourhoods in Leominster
Navigate through our locations to find the location of your next house in Leominster, County of Herefordshire for sale or to rent.
Transport in Leominster
Please see below transportation links in this area:
-
 Leominster Station
 -
Ludlow Station
-
Bucknell Station
-
Hopton Heath Station
-
Hereford Station
-
Knighton Station
-
Broome Station
-
Craven Arms Station
- FAQ
- Price Paid By Year
- Property Type Price
Frequently asked questions about Leominster
What is the average price for a property for sale in Leominster?
The average price for a property for sale in Leominster is £299,347. This amount is 7% lower than the average price in County of Herefordshire. There are 6,842 property listings for sale in Leominster.
What locations have the most expensive properties for sale in Leominster?
The locations with the most expensive properties for sale in Leominster are Bringsty at an average of £587,500, Hampton Court at an average of £482,213 and Upton at an average of £426,472.
What locations have the most affordable properties for sale in Leominster?
The locations with the most affordable properties for sale in Leominster are Leominster East at an average of £160,440, Leominster North at an average of £214,284 and Leominster South at an average of £245,843.
Which train stations are available in or near Leominster?
Some of the train stations available in or near Leominster are Leominster, Ludlow and Bucknell.
Property Price Paid in Leominster by Year
The average sold property price by year was:
| Year | Average Sold Price | Price Change |
Sold Properties
|
|---|---|---|---|
| 2024 | £367,540 | 13% |
10 Properties |
| 2023 | £318,181 | 3% |
233 Properties |
| 2022 | £307,962 | 8% |
319 Properties |
| 2021 | £281,816 | 2% |
446 Properties |
| 2020 | £276,628 | 11% |
275 Properties |
| 2019 | £245,933 | 2% |
321 Properties |
| 2018 | £241,384 | 7% |
350 Properties |
| 2017 | £224,471 | 2% |
373 Properties |
| 2016 | £220,904 | 0,1% |
354 Properties |
| 2015 | £220,600 | 8% |
296 Properties |
| 2014 | £203,075 | -5% |
359 Properties |
| 2013 | £213,411 | 7% |
255 Properties |
| 2012 | £198,556 | -0,3% |
225 Properties |
| 2011 | £199,096 | -3% |
244 Properties |
| 2010 | £205,861 | 3% |
216 Properties |
| 2009 | £199,108 | -4% |
224 Properties |
| 2008 | £207,826 | -5% |
219 Properties |
| 2007 | £218,038 | 6% |
383 Properties |
| 2006 | £204,874 | 12% |
406 Properties |
| 2005 | £180,965 | 1% |
343 Properties |
| 2004 | £179,481 | 17% |
407 Properties |
| 2003 | £148,405 | 16% |
428 Properties |
| 2002 | £124,263 | 19% |
497 Properties |
| 2001 | £100,537 | 11% |
406 Properties |
| 2000 | £89,205 | 2% |
438 Properties |
| 1999 | £87,253 | 11% |
493 Properties |
| 1998 | £77,336 | 16% |
465 Properties |
| 1997 | £64,699 | -2% |
394 Properties |
| 1996 | £65,709 | 5% |
385 Properties |
| 1995 | £62,363 | - |
291 Properties |
Property Price per Property Type in Leominster
Here you can find historic sold price data in order to help with your property search.
The average Property Paid Price for specific property types in the last three years are:
| Property Type | Average Sold Price | Sold Properties |
|---|---|---|
| Semi Detached House | £236,180.00 | 267 Semi Detached Houses |
| Terraced House | £209,524.00 | 222 Terraced Houses |
| Detached House | £408,367.00 | 454 Detached Houses |
| Flat | £104,131.00 | 65 Flats |