
Houses for sale & to rent in Carnforth, Cumbria
House Prices in Carnforth
Properties in Carnforth have an average house price of £359,790.00 and had 599 Property Transactions within the last 3 years.¹
Carnforth is an area in Cumbria with 3,891 households², where the most expensive property was sold for £1,790,000.00.
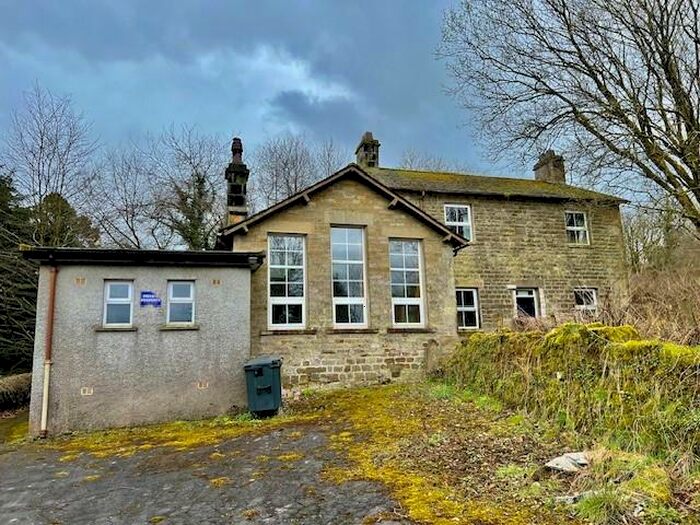
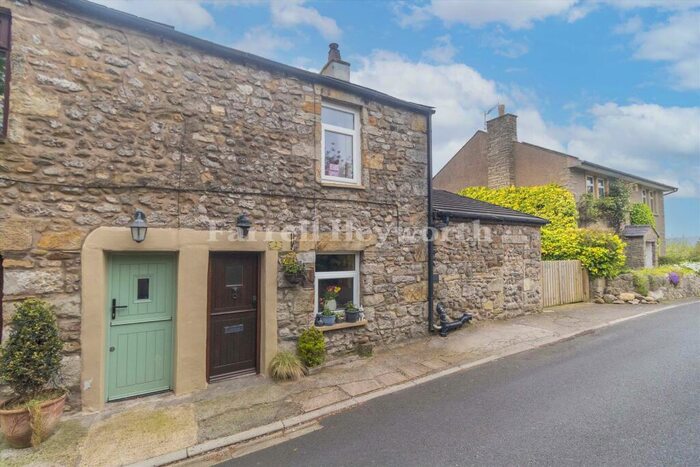
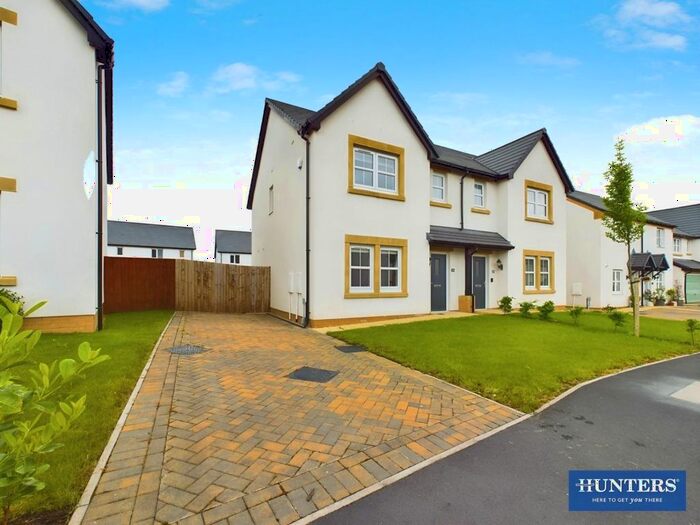
Properties for sale in Carnforth


Neighbourhoods in Carnforth
Navigate through our locations to find the location of your next house in Carnforth, Cumbria for sale or to rent.
Transport in Carnforth
Please see below transportation links in this area:
-
 Silverdale Station
 -
Arnside Station
-
Carnforth Station
-
Oxenholme Lake District Station
-
Wennington Station
-
Grange-Over-Sands Station
-
Kendal Station
-
Kents Bank Station
-
Bentham Station
- FAQ
- Price Paid By Year
- Property Type Price
Frequently asked questions about Carnforth
What is the average price for a property for sale in Carnforth?
The average price for a property for sale in Carnforth is £359,790. This amount is 49% higher than the average price in Cumbria. There are 5,849 property listings for sale in Carnforth.
What locations have the most expensive properties for sale in Carnforth?
The locations with the most expensive properties for sale in Carnforth are Burton & Crooklands at an average of £630,000, Kendal Rural at an average of £556,250 and Sedbergh And Kirkby Lonsdale at an average of £409,517.
What locations have the most affordable properties for sale in Carnforth?
The locations with the most affordable properties for sale in Carnforth are Burton And Holme at an average of £303,316, Arnside And Beetham at an average of £361,979 and Sedbergh & Kirkby Lonsdale at an average of £383,805.
Which train stations are available in or near Carnforth?
Some of the train stations available in or near Carnforth are Silverdale, Arnside and Carnforth.
Property Price Paid in Carnforth by Year
The average sold property price by year was:
| Year | Average Sold Price | Price Change |
Sold Properties
|
|---|---|---|---|
| 2024 | £321,727 | -20% |
11 Properties |
| 2023 | £387,001 | 10% |
127 Properties |
| 2022 | £346,619 | -3% |
196 Properties |
| 2021 | £358,070 | 18% |
265 Properties |
| 2020 | £292,325 | -7% |
162 Properties |
| 2019 | £314,123 | 14% |
211 Properties |
| 2018 | £271,665 | -3% |
168 Properties |
| 2017 | £279,802 | 2% |
158 Properties |
| 2016 | £275,408 | 3% |
191 Properties |
| 2015 | £266,819 | 4% |
179 Properties |
| 2014 | £256,791 | 3% |
182 Properties |
| 2013 | £248,031 | 0,2% |
151 Properties |
| 2012 | £247,655 | 6% |
137 Properties |
| 2011 | £232,970 | -9% |
116 Properties |
| 2010 | £253,977 | -3% |
129 Properties |
| 2009 | £260,591 | -10% |
126 Properties |
| 2008 | £287,905 | 7% |
137 Properties |
| 2007 | £267,056 | 6% |
190 Properties |
| 2006 | £251,595 | -2% |
219 Properties |
| 2005 | £255,906 | 12% |
186 Properties |
| 2004 | £226,355 | 21% |
212 Properties |
| 2003 | £178,310 | 12% |
240 Properties |
| 2002 | £157,598 | 24% |
290 Properties |
| 2001 | £119,649 | 15% |
222 Properties |
| 2000 | £102,212 | 2% |
206 Properties |
| 1999 | £100,457 | 16% |
242 Properties |
| 1998 | £84,610 | 4% |
223 Properties |
| 1997 | £80,980 | 7% |
208 Properties |
| 1996 | £75,294 | -8% |
178 Properties |
| 1995 | £81,121 | - |
128 Properties |
Property Price per Property Type in Carnforth
Here you can find historic sold price data in order to help with your property search.
The average Property Paid Price for specific property types in the last three years are:
| Property Type | Average Sold Price | Sold Properties |
|---|---|---|
| Semi Detached House | £326,551.00 | 130 Semi Detached Houses |
| Terraced House | £277,373.00 | 128 Terraced Houses |
| Detached House | £486,622.00 | 229 Detached Houses |
| Flat | £233,235.00 | 112 Flats |