
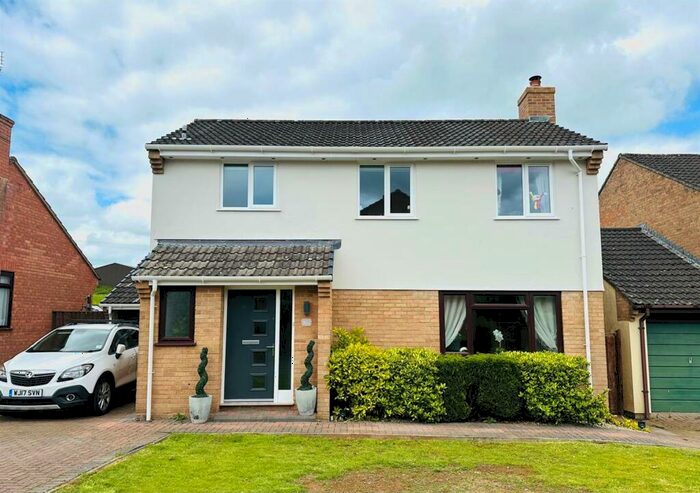
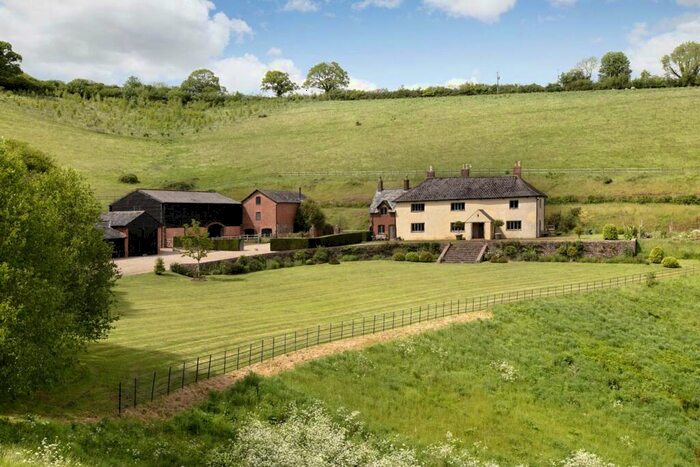
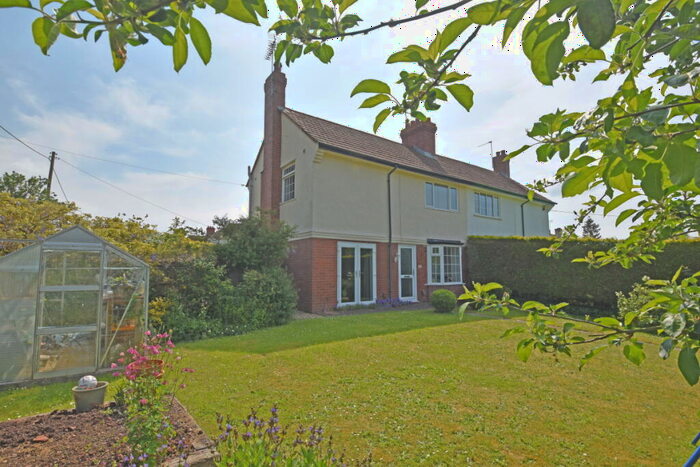
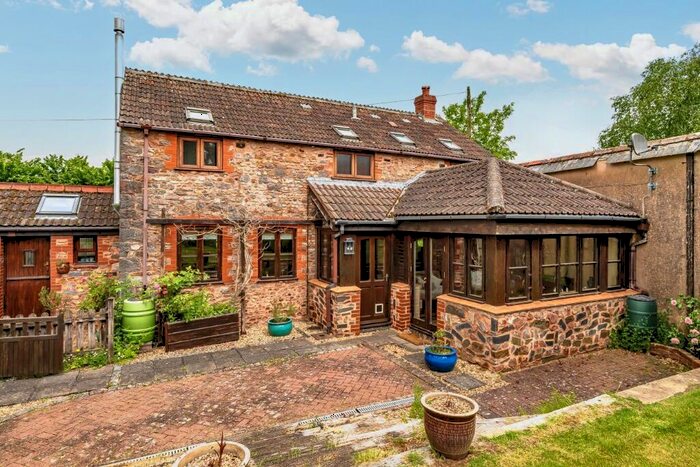
Houses for sale & to rent in Tiverton, Devon
House Prices in Tiverton
Properties in Tiverton have an average house price of £325,423.00 and had 1,547 Property Transactions within the last 3 years.¹
Tiverton is an area in Devon with 13,697 households², where the most expensive property was sold for £2,373,000.00.
Properties for sale in Tiverton


Neighbourhoods in Tiverton
Navigate through our locations to find the location of your next house in Tiverton, Devon for sale or to rent.
Transport in Tiverton
Please see below transportation links in this area:
-
 Tiverton Parkway Station
 -
Newton St.Cyres Station
-
Crediton Station
-
Whimple Station
-
Cranbrook Station
-
Pinhoe Station
-
Feniton Station
-
Polsloe Bridge Station
-
St.James' Park Station
-
Exeter St. David's Station
- FAQ
- Price Paid By Year
- Property Type Price
Frequently asked questions about Tiverton
What is the average price for a property for sale in Tiverton?
The average price for a property for sale in Tiverton is £325,423. This amount is 10% lower than the average price in Devon. There are more than 10,000 property listings for sale in Tiverton.
What locations have the most expensive properties for sale in Tiverton?
The locations with the most expensive properties for sale in Tiverton are Upper Culm at an average of £574,591, Cadbury at an average of £550,333 and Way at an average of £531,520.
What locations have the most affordable properties for sale in Tiverton?
The locations with the most affordable properties for sale in Tiverton are Castle at an average of £245,345, Lowman at an average of £276,803 and Cranmore at an average of £293,237.
Which train stations are available in or near Tiverton?
Some of the train stations available in or near Tiverton are Tiverton Parkway, Newton St.Cyres and Crediton.
Property Price Paid in Tiverton by Year
The average sold property price by year was:
| Year | Average Sold Price | Price Change |
Sold Properties
|
|---|---|---|---|
| 2024 | £295,442 | -11% |
27 Properties |
| 2023 | £327,895 | 1% |
331 Properties |
| 2022 | £325,558 | 0,1% |
495 Properties |
| 2021 | £325,314 | 9% |
694 Properties |
| 2020 | £297,090 | 16% |
550 Properties |
| 2019 | £250,354 | 3% |
510 Properties |
| 2018 | £243,255 | -0,2% |
566 Properties |
| 2017 | £243,802 | 7% |
605 Properties |
| 2016 | £227,035 | -0,1% |
609 Properties |
| 2015 | £227,183 | 7% |
623 Properties |
| 2014 | £210,402 | -0,5% |
616 Properties |
| 2013 | £211,397 | 3% |
503 Properties |
| 2012 | £205,483 | -6% |
456 Properties |
| 2011 | £217,484 | 1% |
407 Properties |
| 2010 | £216,283 | 9% |
417 Properties |
| 2009 | £197,123 | -5% |
434 Properties |
| 2008 | £207,826 | -9% |
351 Properties |
| 2007 | £226,795 | 12% |
703 Properties |
| 2006 | £200,541 | 7% |
898 Properties |
| 2005 | £186,858 | 1% |
586 Properties |
| 2004 | £184,966 | 14% |
711 Properties |
| 2003 | £158,925 | 15% |
722 Properties |
| 2002 | £134,434 | 22% |
719 Properties |
| 2001 | £104,289 | 7% |
648 Properties |
| 2000 | £97,114 | 17% |
619 Properties |
| 1999 | £81,075 | 12% |
627 Properties |
| 1998 | £71,557 | 4% |
543 Properties |
| 1997 | £68,676 | 11% |
637 Properties |
| 1996 | £61,327 | -1% |
475 Properties |
| 1995 | £61,793 | - |
424 Properties |
Property Price per Property Type in Tiverton
Here you can find historic sold price data in order to help with your property search.
The average Property Paid Price for specific property types in the last three years are:
| Property Type | Average Sold Price | Sold Properties |
|---|---|---|
| Terraced House | £242,229.00 | 504 Terraced Houses |
| Flat | £146,445.00 | 119 Flats |
| Semi Detached House | £285,584.00 | 348 Semi Detached Houses |
| Detached House | £459,264.00 | 576 Detached Houses |