
Houses for sale & to rent in Uckfield, East Sussex
House Prices in Uckfield
Properties in Uckfield have an average house price of £497,059.00 and had 1,468 Property Transactions within the last 3 years.¹
Uckfield is an area in East Sussex with 10,738 households², where the most expensive property was sold for £3,619,366.00.
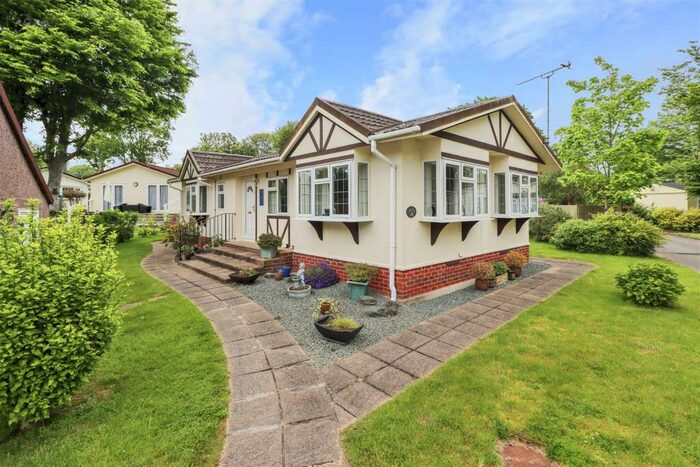
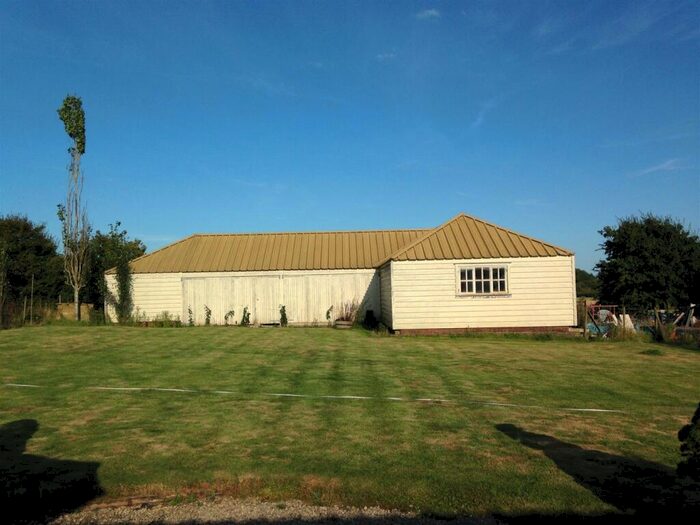
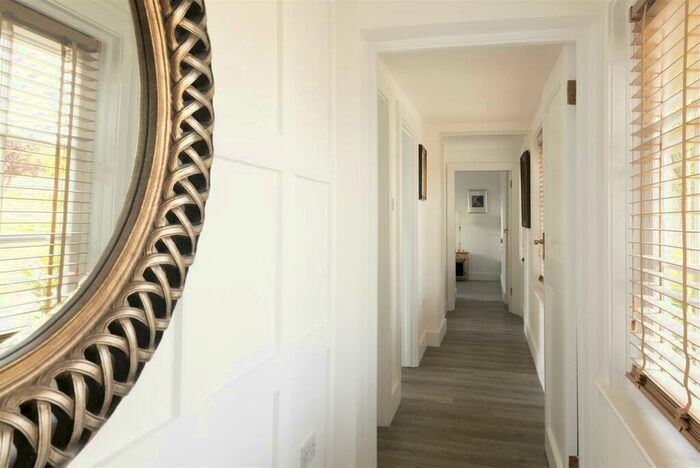
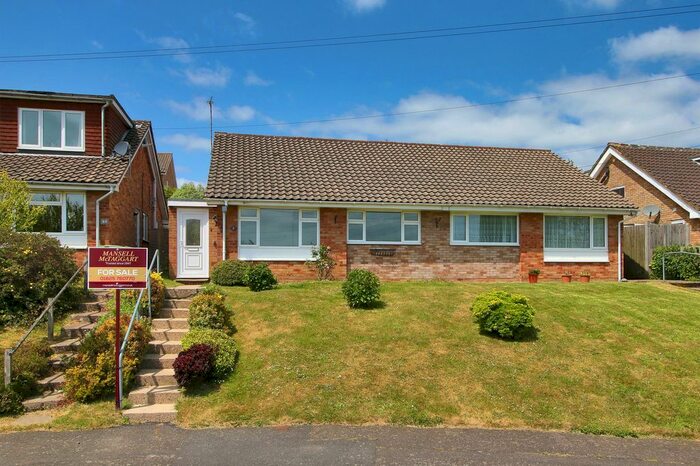
Properties for sale in Uckfield


Neighbourhoods in Uckfield
Navigate through our locations to find the location of your next house in Uckfield, East Sussex for sale or to rent.
- Buxted And Maresfield
- Chailey And Wivelsfield
- Cross In Hand/five Ashes
- Danehill/fletching/nutley
- Framfield
- Hartfield
- Ouse Valley And Ringmer
- Uckfield Central
- Uckfield New Town
- Uckfield North
- Uckfield Ridgewood
- Uckfield East
- Maresfield
- Buxted
- Danehill & Fletching
- Chailey, Barcombe & Hamsey
- Hadlow Down & Rotherfield
- Framfield & Cross-in-Hand
- Uckfield Ridgewood & Little Horsted
- Chiddingly, East Hoathly & Waldron
- Ouse Valley & Ringmer
Transport in Uckfield
Please see below transportation links in this area:
-
 Uckfield Station
 -
Buxted Station
-
Crowborough Station
-
Cooksbridge Station
-
Plumpton Station
-
Eridge Station
-
Glynde Station
-
Lewes Station
-
Haywards Heath Station
-
Wivelsfield Station
- FAQ
- Price Paid By Year
- Property Type Price
Frequently asked questions about Uckfield
What is the average price for a property for sale in Uckfield?
The average price for a property for sale in Uckfield is £497,059. This amount is 24% higher than the average price in East Sussex. There are 5,329 property listings for sale in Uckfield.
What locations have the most expensive properties for sale in Uckfield?
The locations with the most expensive properties for sale in Uckfield are Hartfield at an average of £772,162, Danehill/fletching/nutley at an average of £753,413 and Framfield at an average of £707,299.
What locations have the most affordable properties for sale in Uckfield?
The locations with the most affordable properties for sale in Uckfield are Uckfield New Town at an average of £327,398, Buxted at an average of £344,625 and Uckfield North at an average of £354,862.
Which train stations are available in or near Uckfield?
Some of the train stations available in or near Uckfield are Uckfield, Buxted and Crowborough.
Property Price Paid in Uckfield by Year
The average sold property price by year was:
| Year | Average Sold Price | Price Change |
Sold Properties
|
|---|---|---|---|
| 2024 | £410,875 | -24% |
20 Properties |
| 2023 | £508,304 | 3% |
303 Properties |
| 2022 | £492,146 | -1% |
484 Properties |
| 2021 | £498,110 | 9% |
661 Properties |
| 2020 | £453,547 | 6% |
416 Properties |
| 2019 | £424,300 | 2% |
444 Properties |
| 2018 | £415,301 | 4% |
453 Properties |
| 2017 | £397,224 | 3% |
486 Properties |
| 2016 | £386,788 | 4% |
446 Properties |
| 2015 | £371,608 | 6% |
461 Properties |
| 2014 | £348,988 | 8% |
523 Properties |
| 2013 | £319,389 | 8% |
545 Properties |
| 2012 | £295,422 | 4% |
532 Properties |
| 2011 | £282,983 | -14% |
476 Properties |
| 2010 | £323,765 | 12% |
436 Properties |
| 2009 | £285,838 | -5% |
414 Properties |
| 2008 | £300,128 | 0,5% |
286 Properties |
| 2007 | £298,646 | 7% |
654 Properties |
| 2006 | £279,073 | 8% |
607 Properties |
| 2005 | £256,399 | -2% |
469 Properties |
| 2004 | £262,522 | 11% |
621 Properties |
| 2003 | £232,554 | 13% |
601 Properties |
| 2002 | £201,742 | 12% |
720 Properties |
| 2001 | £177,908 | 11% |
589 Properties |
| 2000 | £158,344 | 8% |
528 Properties |
| 1999 | £145,787 | 16% |
712 Properties |
| 1998 | £122,455 | 12% |
666 Properties |
| 1997 | £108,152 | 3% |
632 Properties |
| 1996 | £104,821 | 8% |
638 Properties |
| 1995 | £96,339 | - |
496 Properties |
Property Price per Property Type in Uckfield
Here you can find historic sold price data in order to help with your property search.
The average Property Paid Price for specific property types in the last three years are:
| Property Type | Average Sold Price | Sold Properties |
|---|---|---|
| Terraced House | £333,847.00 | 305 Terraced Houses |
| Flat | £203,271.00 | 163 Flats |
| Semi Detached House | £410,521.00 | 390 Semi Detached Houses |
| Detached House | £712,497.00 | 610 Detached Houses |