
Houses for sale & to rent in Wadhurst, East Sussex
House Prices in Wadhurst
Properties in Wadhurst have an average house price of £609,573.00 and had 461 Property Transactions within the last 3 years.¹
Wadhurst is an area in East Sussex with 3,483 households², where the most expensive property was sold for £3,800,000.00.
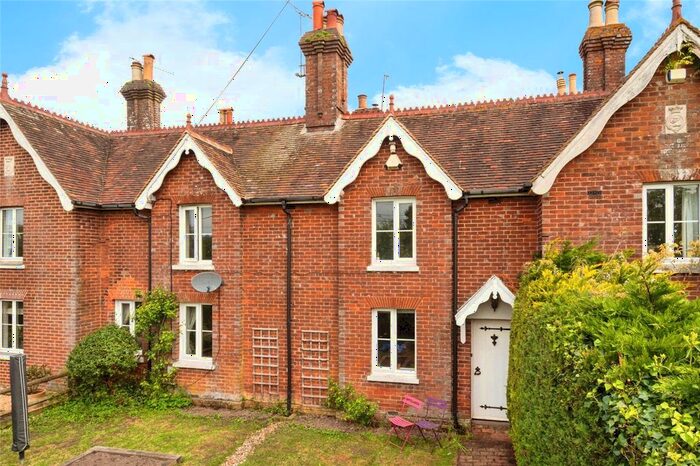
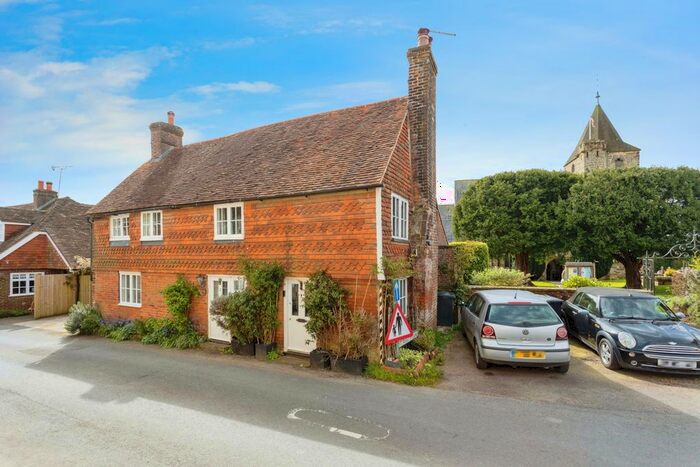
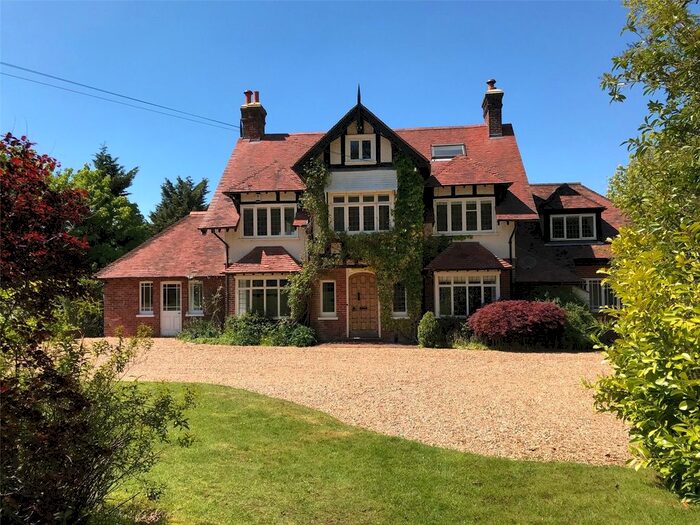
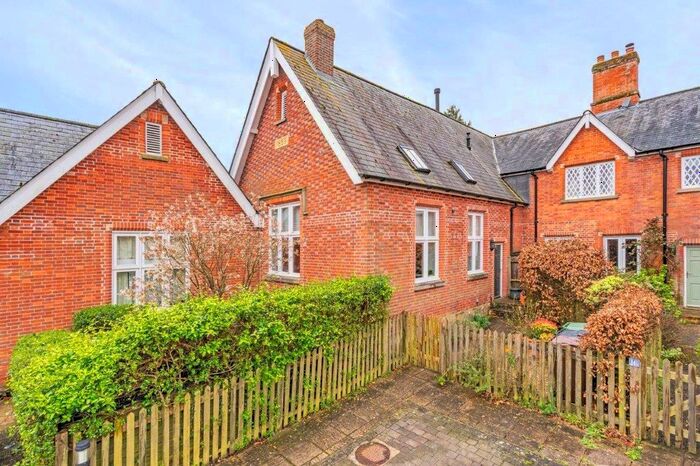
Properties for sale in Wadhurst


Neighbourhoods in Wadhurst
Navigate through our locations to find the location of your next house in Wadhurst, East Sussex for sale or to rent.
Transport in Wadhurst
Please see below transportation links in this area:

- FAQ
- Price Paid By Year
- Property Type Price
Frequently asked questions about Wadhurst
What is the average price for a property for sale in Wadhurst?
The average price for a property for sale in Wadhurst is £609,573. This amount is 44% higher than the average price in East Sussex. There are 1,244 property listings for sale in Wadhurst.
What locations have the most expensive properties for sale in Wadhurst?
The locations with the most expensive properties for sale in Wadhurst are Frant & Wadhurst at an average of £872,221 and Wadhurst at an average of £632,686.
What locations have the most affordable properties for sale in Wadhurst?
The locations with the most affordable properties for sale in Wadhurst are Hurst Green & Ticehurst at an average of £460,075 and Ticehurst And Etchingham at an average of £550,685.
Which train stations are available in or near Wadhurst?
Some of the train stations available in or near Wadhurst are Wadhurst, Stonegate and Frant.
Property Price Paid in Wadhurst by Year
The average sold property price by year was:
| Year | Average Sold Price | Price Change |
Sold Properties
|
|---|---|---|---|
| 2024 | £629,325 | -1% |
12 Properties |
| 2023 | £638,078 | 1% |
76 Properties |
| 2022 | £629,763 | 7% |
134 Properties |
| 2021 | £588,197 | -1% |
239 Properties |
| 2020 | £596,521 | 26% |
143 Properties |
| 2019 | £443,988 | -21% |
122 Properties |
| 2018 | £538,078 | 3% |
143 Properties |
| 2017 | £523,840 | 8% |
127 Properties |
| 2016 | £480,516 | 11% |
149 Properties |
| 2015 | £426,270 | -1% |
140 Properties |
| 2014 | £429,098 | 14% |
154 Properties |
| 2013 | £370,760 | -19% |
140 Properties |
| 2012 | £439,844 | 11% |
129 Properties |
| 2011 | £392,707 | -1% |
111 Properties |
| 2010 | £396,570 | -23% |
117 Properties |
| 2009 | £489,272 | 19% |
108 Properties |
| 2008 | £397,254 | 13% |
100 Properties |
| 2007 | £347,306 | 4% |
190 Properties |
| 2006 | £334,692 | -8% |
207 Properties |
| 2005 | £362,040 | 15% |
138 Properties |
| 2004 | £309,039 | 10% |
183 Properties |
| 2003 | £279,212 | 5% |
152 Properties |
| 2002 | £266,410 | 6% |
180 Properties |
| 2001 | £251,186 | 15% |
151 Properties |
| 2000 | £212,389 | 18% |
160 Properties |
| 1999 | £174,471 | 8% |
201 Properties |
| 1998 | £160,916 | 11% |
174 Properties |
| 1997 | £142,440 | 15% |
199 Properties |
| 1996 | £121,623 | -5% |
216 Properties |
| 1995 | £127,677 | - |
140 Properties |
Property Price per Property Type in Wadhurst
Here you can find historic sold price data in order to help with your property search.
The average Property Paid Price for specific property types in the last three years are:
| Property Type | Average Sold Price | Sold Properties |
|---|---|---|
| Semi Detached House | £479,700.00 | 148 Semi Detached Houses |
| Terraced House | £406,885.00 | 96 Terraced Houses |
| Detached House | £908,710.00 | 174 Detached Houses |
| Flat | £298,630.00 | 43 Flats |