
Houses for sale & to rent in Frinton-on-sea, Essex
House Prices in Frinton-on-sea
Properties in Frinton-on-sea have an average house price of £368,741.00 and had 991 Property Transactions within the last 3 years.¹
Frinton-on-sea is an area in Essex with 5,749 households², where the most expensive property was sold for £2,200,000.00.
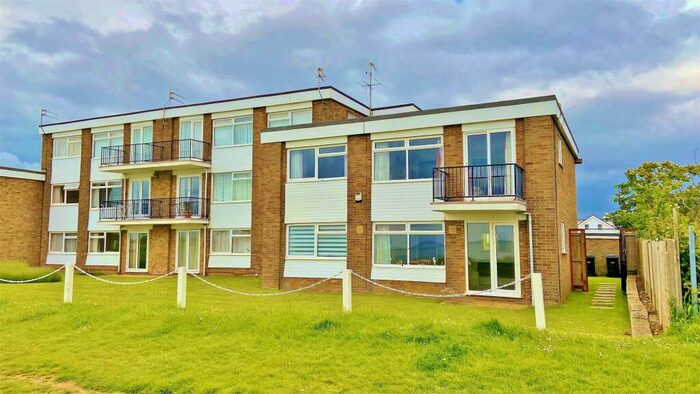
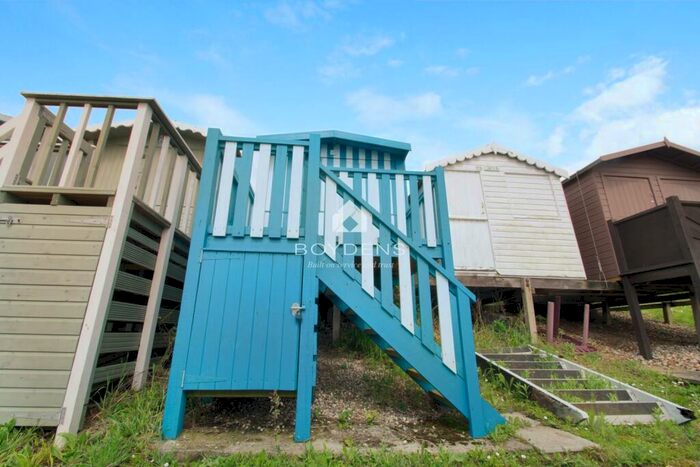
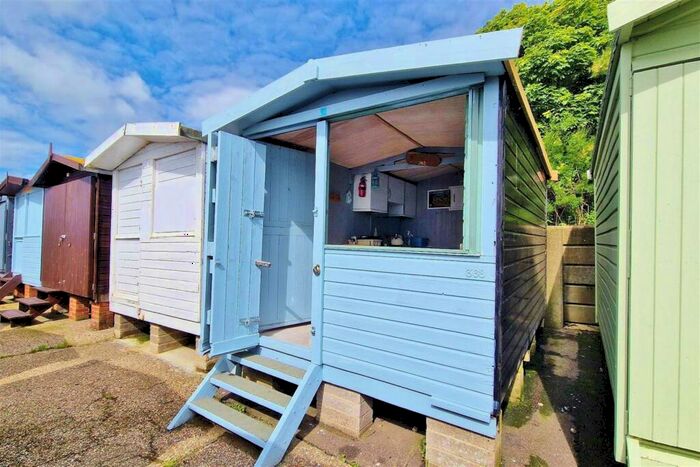
Properties for sale in Frinton-on-sea


Neighbourhoods in Frinton-on-sea
Navigate through our locations to find the location of your next house in Frinton-on-sea, Essex for sale or to rent.
Transport in Frinton-on-sea
Please see below transportation links in this area:

- FAQ
- Price Paid By Year
- Property Type Price
Frequently asked questions about Frinton-on-sea
What is the average price for a property for sale in Frinton-on-sea?
The average price for a property for sale in Frinton-on-sea is £368,741. This amount is 9% lower than the average price in Essex. There are 1,735 property listings for sale in Frinton-on-sea.
What locations have the most expensive properties for sale in Frinton-on-sea?
The locations with the most expensive properties for sale in Frinton-on-sea are Beaumont And Thorpe at an average of £999,500, Frinton at an average of £397,593 and Kirby Cross at an average of £356,404.
What locations have the most affordable properties for sale in Frinton-on-sea?
The locations with the most affordable properties for sale in Frinton-on-sea are Kirby-le-Soken & Hamford at an average of £260,000, Hamford at an average of £340,142 and Holland And Kirby at an average of £353,403.
Which train stations are available in or near Frinton-on-sea?
Some of the train stations available in or near Frinton-on-sea are Frinton, Kirby Cross and Walton-On-Naze.
Property Price Paid in Frinton-on-sea by Year
The average sold property price by year was:
| Year | Average Sold Price | Price Change |
Sold Properties
|
|---|---|---|---|
| 2024 | £311,815 | -26% |
17 Properties |
| 2023 | £391,551 | 4% |
192 Properties |
| 2022 | £374,299 | 5% |
324 Properties |
| 2021 | £357,360 | 7% |
458 Properties |
| 2020 | £333,814 | 3% |
318 Properties |
| 2019 | £323,045 | 0,1% |
290 Properties |
| 2018 | £322,683 | 3% |
340 Properties |
| 2017 | £313,754 | 9% |
321 Properties |
| 2016 | £284,241 | 7% |
398 Properties |
| 2015 | £263,171 | 10% |
372 Properties |
| 2014 | £238,119 | 7% |
429 Properties |
| 2013 | £220,388 | -7% |
260 Properties |
| 2012 | £236,262 | 3% |
237 Properties |
| 2011 | £230,347 | 3% |
192 Properties |
| 2010 | £224,132 | 11% |
272 Properties |
| 2009 | £199,707 | -18% |
274 Properties |
| 2008 | £236,299 | 3% |
196 Properties |
| 2007 | £229,978 | 4% |
425 Properties |
| 2006 | £221,649 | 6% |
406 Properties |
| 2005 | £207,344 | -0,1% |
276 Properties |
| 2004 | £207,629 | 13% |
328 Properties |
| 2003 | £181,156 | 17% |
358 Properties |
| 2002 | £150,694 | 18% |
418 Properties |
| 2001 | £123,908 | 17% |
428 Properties |
| 2000 | £103,419 | 13% |
374 Properties |
| 1999 | £90,475 | 6% |
482 Properties |
| 1998 | £84,803 | 14% |
378 Properties |
| 1997 | £72,716 | 3% |
385 Properties |
| 1996 | £70,601 | -3% |
320 Properties |
| 1995 | £72,564 | - |
279 Properties |
Property Price per Property Type in Frinton-on-sea
Here you can find historic sold price data in order to help with your property search.
The average Property Paid Price for specific property types in the last three years are:
| Property Type | Average Sold Price | Sold Properties |
|---|---|---|
| Semi Detached House | £298,487.00 | 214 Semi Detached Houses |
| Detached House | £446,947.00 | 539 Detached Houses |
| Flat | £246,899.00 | 178 Flats |
| Terraced House | £278,229.00 | 60 Terraced Houses |