
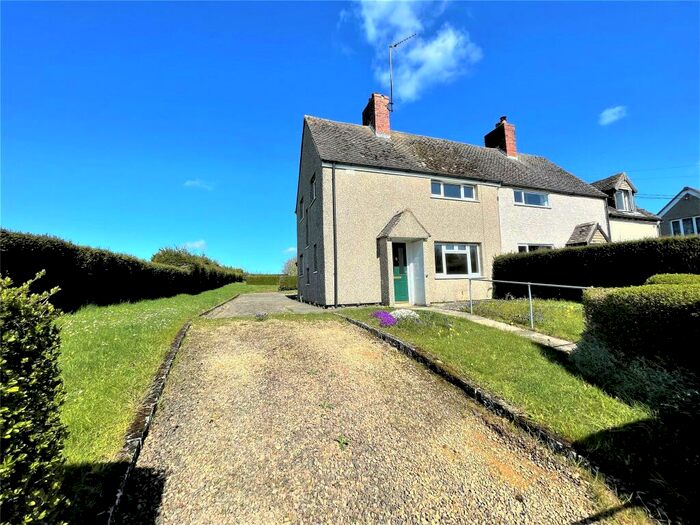
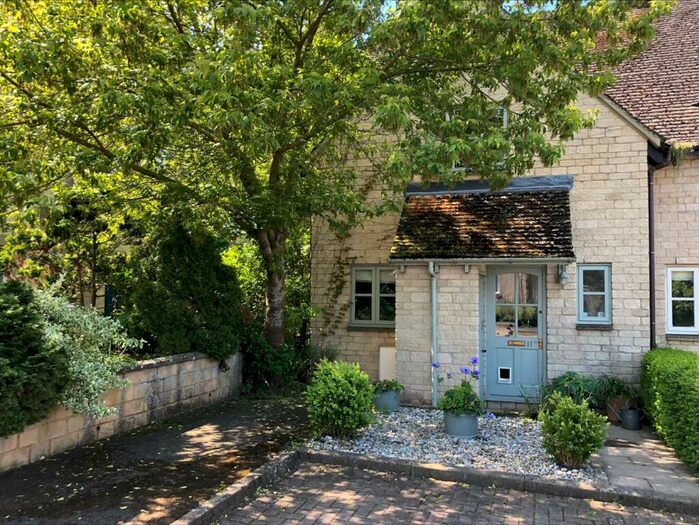
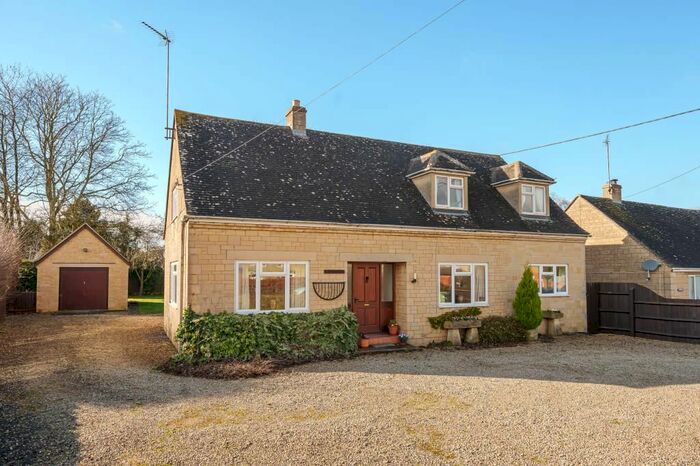
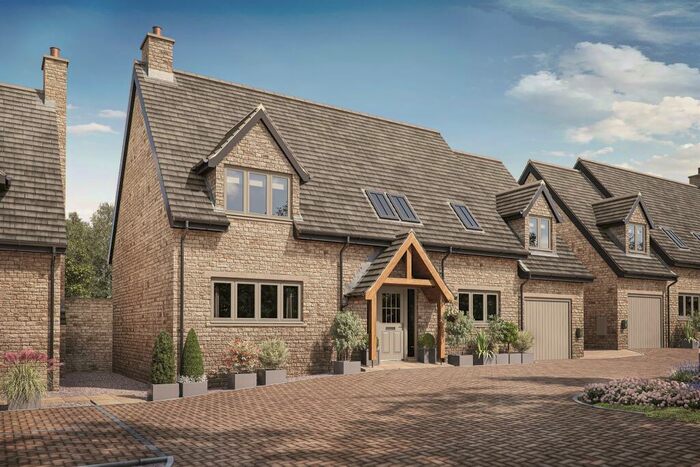
Houses for sale & to rent in Chipping Norton, Gloucestershire
House Prices in Chipping Norton
Properties in Chipping Norton have an average house price of £811,047.00 and had 41 Property Transactions within the last 3 years.¹
Chipping Norton is an area in Gloucestershire with 292 households², where the most expensive property was sold for £2,450,000.00.
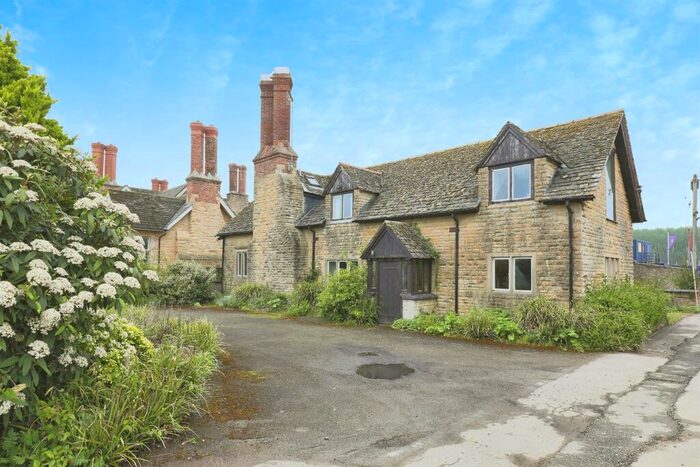
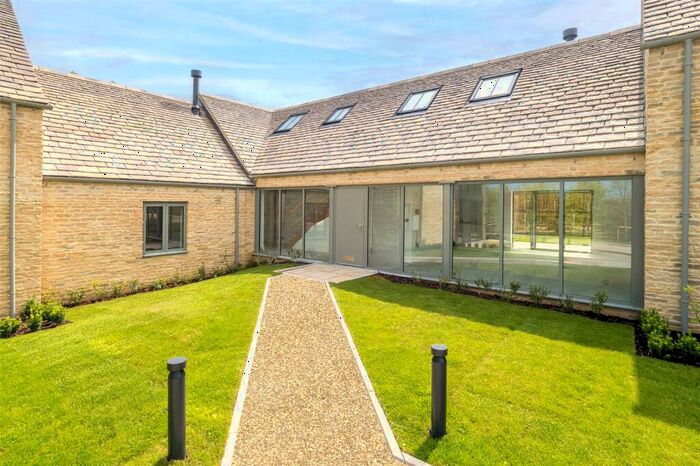
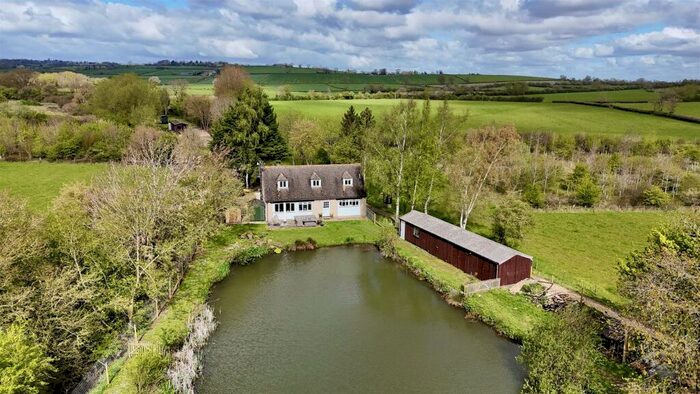
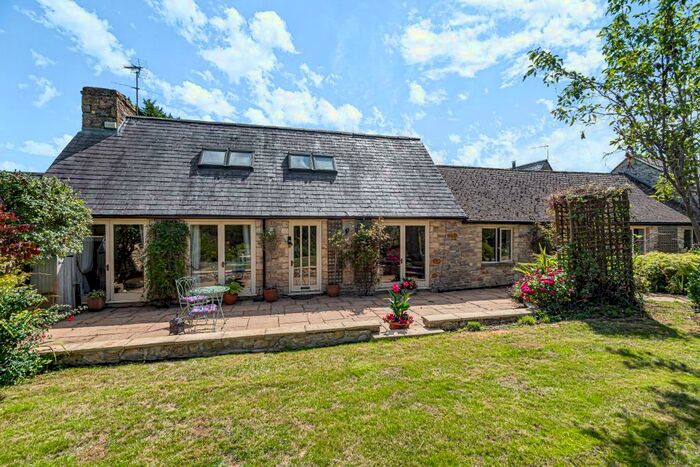
Properties for sale in Chipping Norton


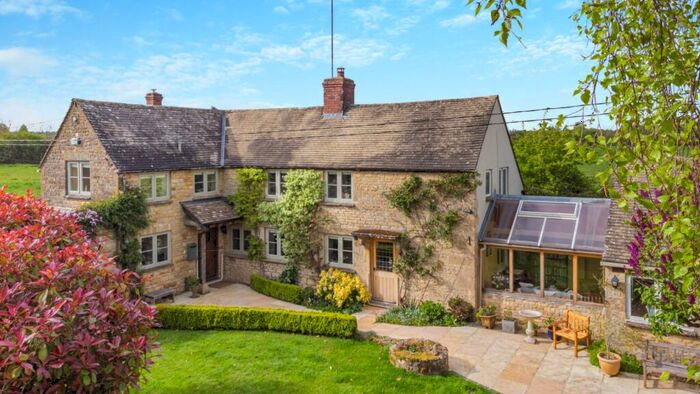
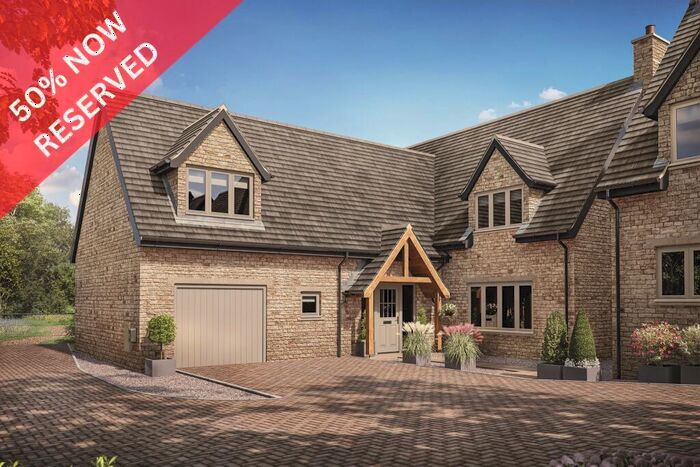
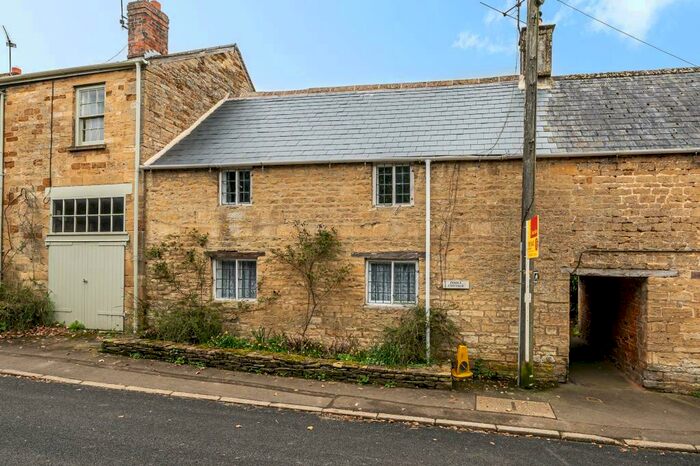

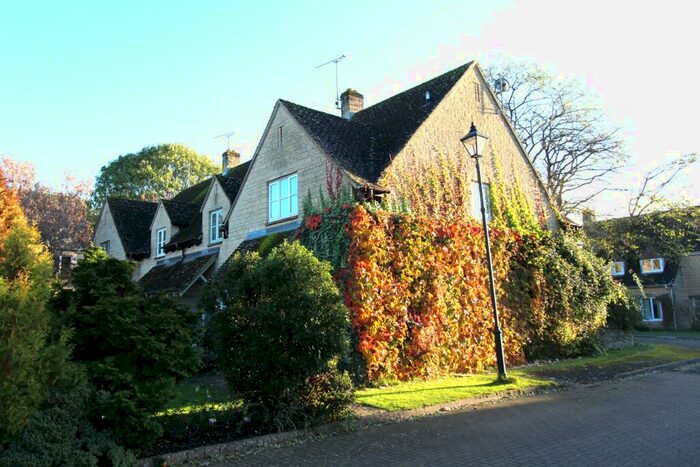
Previously listed properties in Chipping Norton


Neighbourhoods in Chipping Norton
Navigate through our locations to find the location of your next house in Chipping Norton, Gloucestershire for sale or to rent.
Transport in Chipping Norton
Please see below transportation links in this area:

- FAQ
- Price Paid By Year
- Property Type Price
Frequently asked questions about Chipping Norton
What is the average price for a property for sale in Chipping Norton?
The average price for a property for sale in Chipping Norton is £811,047. This amount is 76% higher than the average price in Gloucestershire. There are 70 property listings for sale in Chipping Norton.
What locations have the most expensive properties for sale in Chipping Norton?
The location with the most expensive properties for sale in Chipping Norton is Rissingtons at an average of £948,247.
What locations have the most affordable properties for sale in Chipping Norton?
The location with the most affordable properties for sale in Chipping Norton is Beacon-stow at an average of £703,673.
Which train stations are available in or near Chipping Norton?
Some of the train stations available in or near Chipping Norton are Kingham, Shipton and Ascott-Under-Wychwood.
Property Price Paid in Chipping Norton by Year
The average sold property price by year was:
| Year | Average Sold Price | Price Change |
Sold Properties
|
|---|---|---|---|
| 2024 | £1,060,000 | 19% |
2 Properties |
| 2023 | £862,708 | -4% |
12 Properties |
| 2022 | £900,227 | 24% |
11 Properties |
| 2021 | £679,871 | 9% |
16 Properties |
| 2020 | £618,136 | 5% |
11 Properties |
| 2019 | £589,125 | -4% |
12 Properties |
| 2018 | £615,175 | -14% |
16 Properties |
| 2017 | £702,090 | 33% |
10 Properties |
| 2016 | £468,416 | 16% |
6 Properties |
| 2015 | £393,772 | -12% |
11 Properties |
| 2014 | £440,194 | -5% |
18 Properties |
| 2013 | £461,525 | -12% |
10 Properties |
| 2012 | £515,295 | 25% |
10 Properties |
| 2011 | £385,916 | -11% |
6 Properties |
| 2010 | £427,740 | -16% |
16 Properties |
| 2009 | £497,909 | 3% |
11 Properties |
| 2008 | £482,500 | 18% |
5 Properties |
| 2007 | £397,226 | 12% |
15 Properties |
| 2006 | £350,745 | -8% |
10 Properties |
| 2005 | £379,583 | 1% |
12 Properties |
| 2004 | £377,018 | 35% |
11 Properties |
| 2003 | £244,285 | -34% |
14 Properties |
| 2002 | £326,874 | 7% |
16 Properties |
| 2001 | £305,539 | 28% |
12 Properties |
| 2000 | £220,987 | 32% |
20 Properties |
| 1999 | £149,346 | -12% |
12 Properties |
| 1998 | £167,200 | 20% |
15 Properties |
| 1997 | £133,102 | -27% |
18 Properties |
| 1996 | £169,272 | 24% |
11 Properties |
| 1995 | £129,378 | - |
16 Properties |
Property Price per Property Type in Chipping Norton
Here you can find historic sold price data in order to help with your property search.
The average Property Paid Price for specific property types in the last three years are:
| Property Type | Average Sold Price | Sold Properties |
|---|---|---|
| Semi Detached House | £724,635.00 | 7 Semi Detached Houses |
| Terraced House | £369,611.00 | 9 Terraced Houses |
| Detached House | £994,160.00 | 25 Detached Houses |