
Houses for sale & to rent in Tadley, Hampshire
House Prices in Tadley
Properties in Tadley have an average house price of £437,054.00 and had 1,073 Property Transactions within the last 3 years.¹
Tadley is an area in Hampshire with 9,113 households², where the most expensive property was sold for £7,675,000.00.
Properties for sale in Tadley


Neighbourhoods in Tadley
Navigate through our locations to find the location of your next house in Tadley, Hampshire for sale or to rent.
Transport in Tadley
Please see below transportation links in this area:

- FAQ
- Price Paid By Year
- Property Type Price
Frequently asked questions about Tadley
What is the average price for a property for sale in Tadley?
The average price for a property for sale in Tadley is £437,054. This amount is 4% higher than the average price in Hampshire. There are more than 10,000 property listings for sale in Tadley.
What locations have the most expensive properties for sale in Tadley?
The locations with the most expensive properties for sale in Tadley are Sherborne St John & Rooksdown at an average of £4,705,000, Kingsclere at an average of £997,552 and Tadley North, Kingsclere & Baughurst at an average of £922,500.
What locations have the most affordable properties for sale in Tadley?
The locations with the most affordable properties for sale in Tadley are Tadley South at an average of £341,467, Tadley Central at an average of £342,758 and Baughurst And Tadley North at an average of £443,406.
Which train stations are available in or near Tadley?
Some of the train stations available in or near Tadley are Bramley (Hampshire), Aldermaston and Midgham.
Property Price Paid in Tadley by Year
The average sold property price by year was:
| Year | Average Sold Price | Price Change |
Sold Properties
|
|---|---|---|---|
| 2024 | £368,166 | -17% |
21 Properties |
| 2023 | £429,197 | -4% |
212 Properties |
| 2022 | £445,534 | 2% |
345 Properties |
| 2021 | £437,432 | 7% |
495 Properties |
| 2020 | £405,876 | 3% |
365 Properties |
| 2019 | £393,968 | 6% |
331 Properties |
| 2018 | £368,657 | 5% |
355 Properties |
| 2017 | £350,920 | -2% |
362 Properties |
| 2016 | £357,021 | 9% |
384 Properties |
| 2015 | £325,084 | 8% |
396 Properties |
| 2014 | £299,698 | 5% |
406 Properties |
| 2013 | £284,759 | -3% |
401 Properties |
| 2012 | £294,709 | 8% |
268 Properties |
| 2011 | £271,465 | 0,4% |
292 Properties |
| 2010 | £270,471 | 2% |
323 Properties |
| 2009 | £264,337 | -2% |
331 Properties |
| 2008 | £270,779 | -3% |
247 Properties |
| 2007 | £278,864 | 10% |
431 Properties |
| 2006 | £252,359 | 5% |
526 Properties |
| 2005 | £238,836 | 3% |
382 Properties |
| 2004 | £231,880 | 7% |
502 Properties |
| 2003 | £215,554 | 14% |
496 Properties |
| 2002 | £185,661 | 8% |
561 Properties |
| 2001 | £170,836 | 2% |
575 Properties |
| 2000 | £167,265 | 17% |
500 Properties |
| 1999 | £139,186 | 17% |
735 Properties |
| 1998 | £115,905 | 13% |
513 Properties |
| 1997 | £101,101 | 7% |
531 Properties |
| 1996 | £94,134 | 6% |
461 Properties |
| 1995 | £88,476 | - |
356 Properties |
Property Price per Property Type in Tadley
Here you can find historic sold price data in order to help with your property search.
The average Property Paid Price for specific property types in the last three years are:
| Property Type | Average Sold Price | Sold Properties |
|---|---|---|
| Semi Detached House | £369,594.00 | 293 Semi Detached Houses |
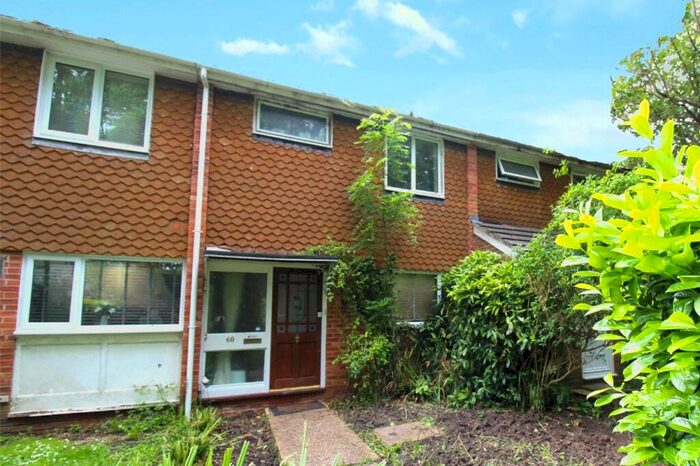
| Terraced House | £301,158.00 | 311 Terraced Houses |
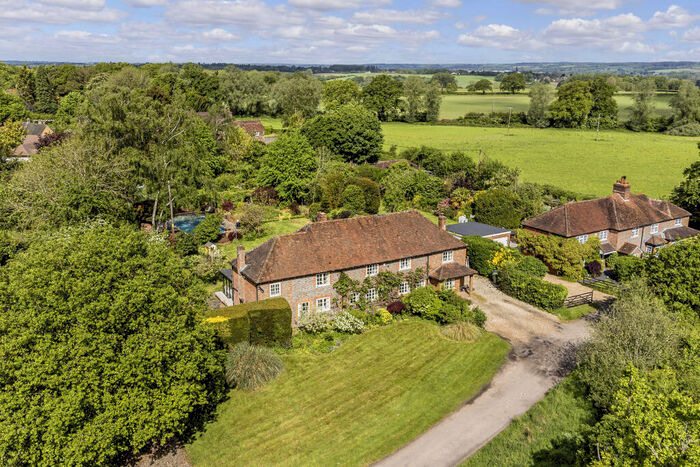
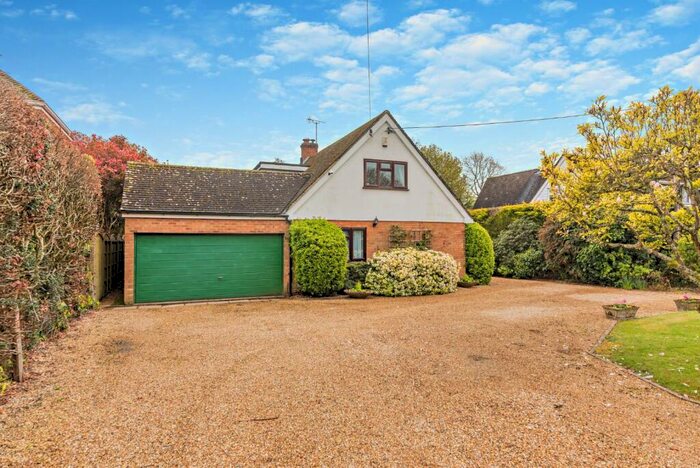
| Detached House | £641,648.00 | 396 Detached Houses |
| Flat | £176,930.00 | 73 Flats |