
Houses for sale & to rent in Sandwich, Kent
House Prices in Sandwich
Properties in Sandwich have an average house price of £398,081.00 and had 498 Property Transactions within the last 3 years.¹
Sandwich is an area in Kent with 3,872 households², where the most expensive property was sold for £3,900,000.00.
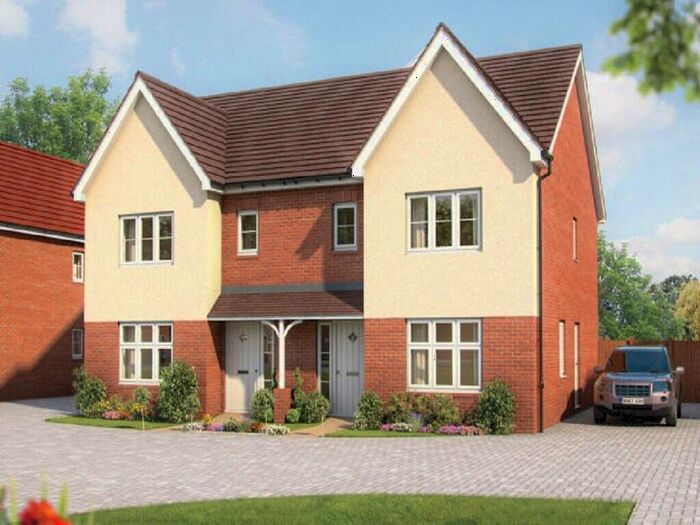
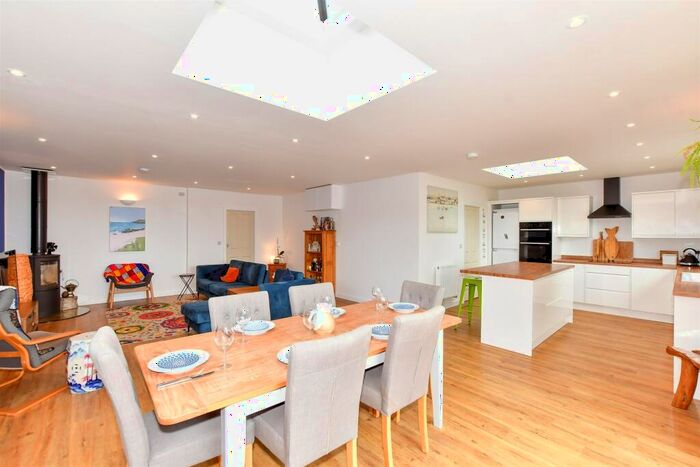
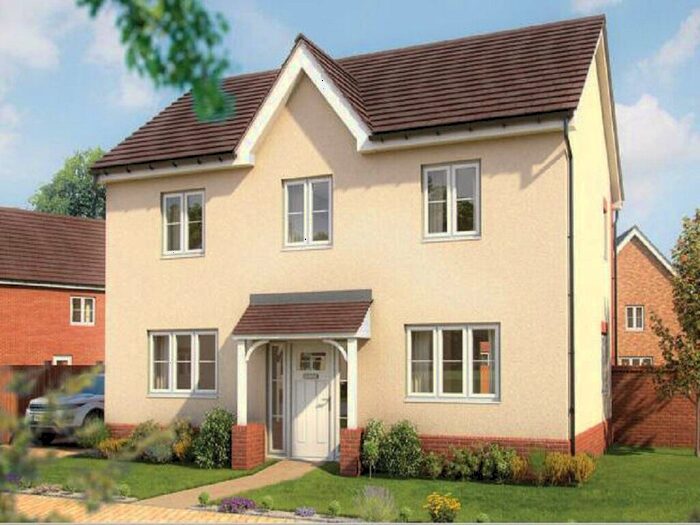
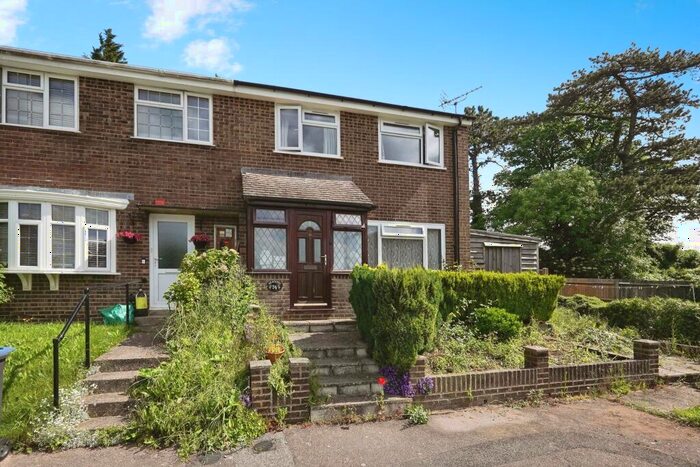
Properties for sale in Sandwich


Neighbourhoods in Sandwich
Navigate through our locations to find the location of your next house in Sandwich, Kent for sale or to rent.
Transport in Sandwich
Please see below transportation links in this area:

- FAQ
- Price Paid By Year
- Property Type Price
Frequently asked questions about Sandwich
What is the average price for a property for sale in Sandwich?
The average price for a property for sale in Sandwich is £398,081. This amount is 0.95% higher than the average price in Kent. There are 1,845 property listings for sale in Sandwich.
What locations have the most expensive properties for sale in Sandwich?
The location with the most expensive properties for sale in Sandwich is Sandwich at an average of £410,100.
What locations have the most affordable properties for sale in Sandwich?
The location with the most affordable properties for sale in Sandwich is Eastry at an average of £339,499.
Which train stations are available in or near Sandwich?
Some of the train stations available in or near Sandwich are Sandwich, Deal and Minster.
Property Price Paid in Sandwich by Year
The average sold property price by year was:
| Year | Average Sold Price | Price Change |
Sold Properties
|
|---|---|---|---|
| 2024 | £313,534 | -34% |
13 Properties |
| 2023 | £419,663 | 1% |
107 Properties |
| 2022 | £415,053 | 9% |
164 Properties |
| 2021 | £379,419 | 7% |
214 Properties |
| 2020 | £354,341 | 8% |
138 Properties |
| 2019 | £324,323 | -6% |
173 Properties |
| 2018 | £344,651 | 3% |
142 Properties |
| 2017 | £333,112 | 1% |
183 Properties |
| 2016 | £330,058 | 12% |
174 Properties |
| 2015 | £290,443 | 10% |
164 Properties |
| 2014 | £262,501 | 16% |
187 Properties |
| 2013 | £220,429 | 2% |
180 Properties |
| 2012 | £216,987 | -8% |
156 Properties |
| 2011 | £234,668 | 1% |
118 Properties |
| 2010 | £232,754 | 2% |
121 Properties |
| 2009 | £228,916 | 4% |
120 Properties |
| 2008 | £219,866 | -5% |
113 Properties |
| 2007 | £230,877 | 5% |
205 Properties |
| 2006 | £219,077 | 5% |
243 Properties |
| 2005 | £207,529 | 5% |
144 Properties |
| 2004 | £197,805 | 9% |
162 Properties |
| 2003 | £179,254 | 18% |
187 Properties |
| 2002 | £147,269 | 11% |
209 Properties |
| 2001 | £130,534 | 5% |
215 Properties |
| 2000 | £124,009 | 19% |
160 Properties |
| 1999 | £100,117 | 3% |
227 Properties |
| 1998 | £96,806 | 10% |
179 Properties |
| 1997 | £87,272 | 15% |
195 Properties |
| 1996 | £74,423 | 3% |
175 Properties |
| 1995 | £72,269 | - |
141 Properties |
Property Price per Property Type in Sandwich
Here you can find historic sold price data in order to help with your property search.
The average Property Paid Price for specific property types in the last three years are:
| Property Type | Average Sold Price | Sold Properties |
|---|---|---|
| Semi Detached House | £345,059.00 | 159 Semi Detached Houses |
| Terraced House | £361,859.00 | 182 Terraced Houses |
| Detached House | £594,801.00 | 110 Detached Houses |
| Flat | £257,310.00 | 47 Flats |