
Houses for sale & to rent in Otley, Leeds
House Prices in Otley
Properties in Otley have an average house price of £303,054.00 and had 810 Property Transactions within the last 3 years.¹
Otley is an area in Leeds with 7,213 households², where the most expensive property was sold for £1,525,000.00.
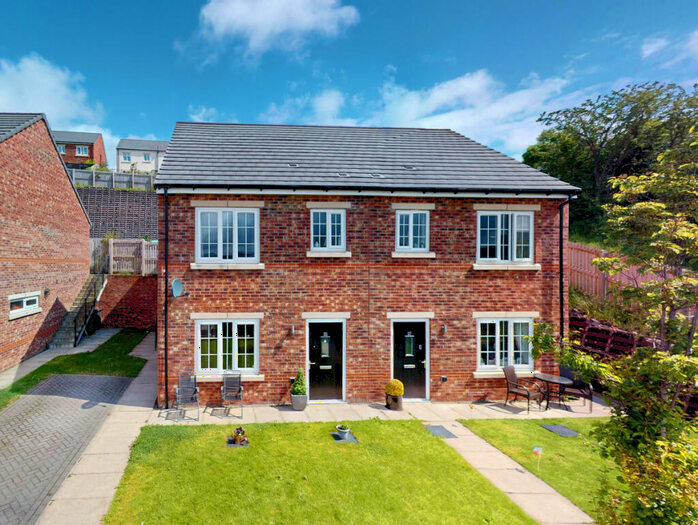
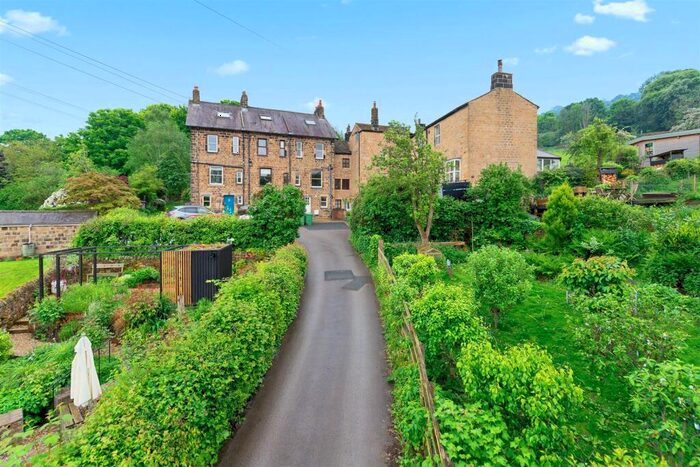
Properties for sale in Otley


Neighbourhoods in Otley
Navigate through our locations to find the location of your next house in Otley, Leeds for sale or to rent.
Transport in Otley
Please see below transportation links in this area:
-
 Guiseley Station
 -
Menston Station
-
Burley-In-Wharfedale Station
-
Weeton Station
-
Horsforth Station
-
Apperley Bridge Station
-
Baildon Station
- FAQ
- Price Paid By Year
- Property Type Price
Frequently asked questions about Otley
What is the average price for a property for sale in Otley?
The average price for a property for sale in Otley is £303,054. This amount is 19% higher than the average price in Leeds. There are 3,770 property listings for sale in Otley.
What locations have the most expensive properties for sale in Otley?
The locations with the most expensive properties for sale in Otley are Adel & Wharfedale at an average of £557,000 and Adel And Wharfedale at an average of £391,258.
What locations have the most affordable properties for sale in Otley?
The locations with the most affordable properties for sale in Otley are Otley And Yeadon at an average of £282,092 and Otley & Yeadon at an average of £326,662.
Which train stations are available in or near Otley?
Some of the train stations available in or near Otley are Guiseley, Menston and Burley-In-Wharfedale.
Property Price Paid in Otley by Year
The average sold property price by year was:
| Year | Average Sold Price | Price Change |
Sold Properties
|
|---|---|---|---|
| 2024 | £307,558 | 1% |
12 Properties |
| 2023 | £305,058 | -3% |
209 Properties |
| 2022 | £314,819 | 7% |
253 Properties |
| 2021 | £292,788 | 5% |
336 Properties |
| 2020 | £279,469 | 9% |
289 Properties |
| 2019 | £255,466 | 7% |
323 Properties |
| 2018 | £237,082 | -1% |
300 Properties |
| 2017 | £240,391 | -4% |
410 Properties |
| 2016 | £250,366 | 7% |
387 Properties |
| 2015 | £233,913 | 10% |
337 Properties |
| 2014 | £211,579 | 6% |
339 Properties |
| 2013 | £199,290 | 4% |
306 Properties |
| 2012 | £192,285 | 0,3% |
206 Properties |
| 2011 | £191,793 | -4% |
238 Properties |
| 2010 | £199,210 | 9% |
210 Properties |
| 2009 | £180,562 | -4% |
201 Properties |
| 2008 | £187,859 | -11% |
170 Properties |
| 2007 | £208,898 | 5% |
379 Properties |
| 2006 | £198,819 | 5% |
424 Properties |
| 2005 | £189,260 | 9% |
303 Properties |
| 2004 | £172,314 | 10% |
328 Properties |
| 2003 | £155,721 | 19% |
448 Properties |
| 2002 | £126,615 | 14% |
400 Properties |
| 2001 | £108,591 | 20% |
411 Properties |
| 2000 | £86,507 | -3% |
350 Properties |
| 1999 | £89,291 | 16% |
363 Properties |
| 1998 | £75,336 | 8% |
320 Properties |
| 1997 | £69,272 | 10% |
361 Properties |
| 1996 | £62,460 | -2% |
343 Properties |
| 1995 | £63,899 | - |
269 Properties |
Property Price per Property Type in Otley
Here you can find historic sold price data in order to help with your property search.
The average Property Paid Price for specific property types in the last three years are:
| Property Type | Average Sold Price | Sold Properties |
|---|---|---|
| Semi Detached House | £298,908.00 | 247 Semi Detached Houses |
| Terraced House | £257,508.00 | 312 Terraced Houses |
| Detached House | £483,992.00 | 142 Detached Houses |
| Flat | £207,103.00 | 109 Flats |