
Houses for sale & to rent in Newcastle Upon Tyne, Northumberland
House Prices in Newcastle Upon Tyne
Properties in Newcastle Upon Tyne have an average house price of £500,703.00 and had 901 Property Transactions within the last 3 years.¹
Newcastle Upon Tyne is an area in Northumberland with 7,213 households², where the most expensive property was sold for £6,000,000.00.
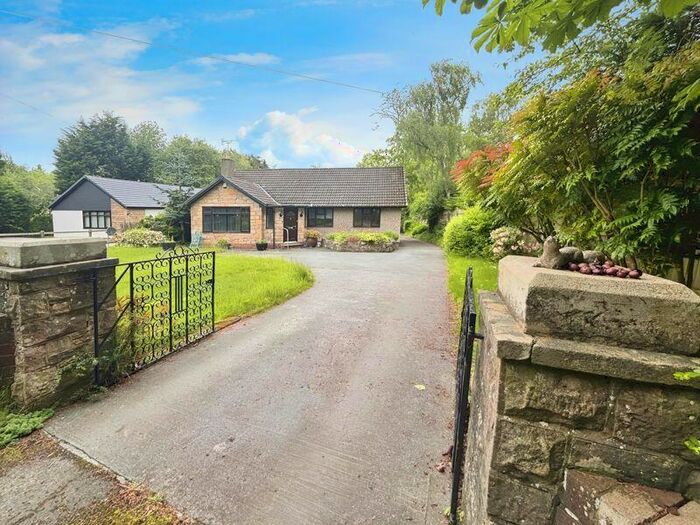
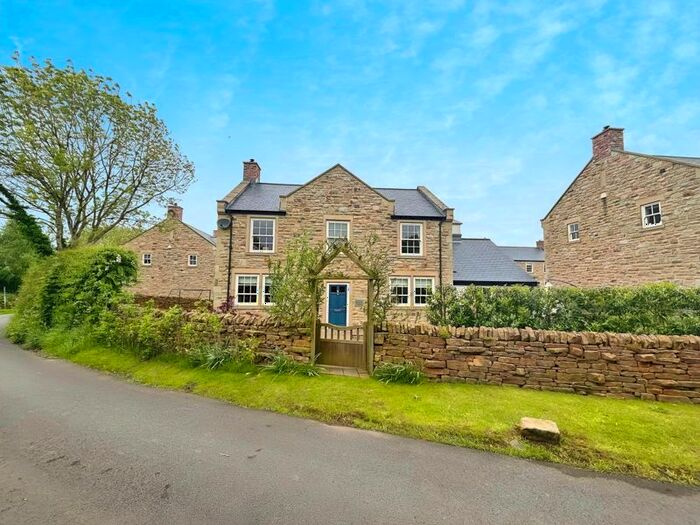
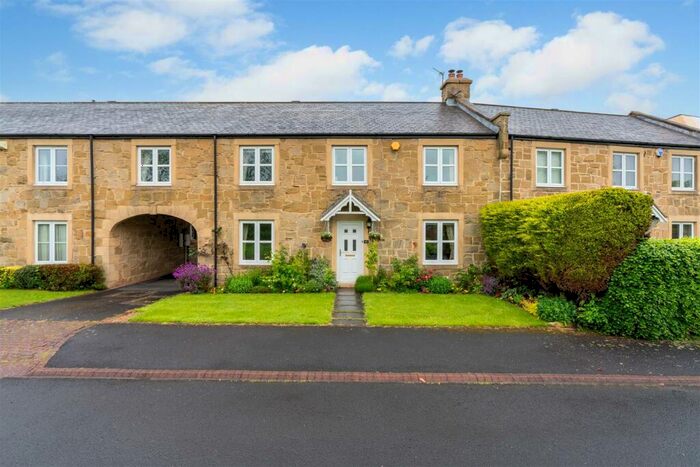
Properties for sale in Newcastle Upon Tyne


Neighbourhoods in Newcastle Upon Tyne
Navigate through our locations to find the location of your next house in Newcastle Upon Tyne, Northumberland for sale or to rent.
Transport in Newcastle Upon Tyne
Please see below transportation links in this area:
-
 Wylam Station
 -
Prudhoe Station
-
Stocksfield Station
-
Corbridge Station
-
Morpeth Station
-
Riding Mill Station
- FAQ
- Price Paid By Year
- Property Type Price
Frequently asked questions about Newcastle Upon Tyne
What is the average price for a property for sale in Newcastle Upon Tyne?
The average price for a property for sale in Newcastle Upon Tyne is £500,703. This amount is 75% higher than the average price in Northumberland. There are more than 10,000 property listings for sale in Newcastle Upon Tyne.
What locations have the most expensive properties for sale in Newcastle Upon Tyne?
The locations with the most expensive properties for sale in Newcastle Upon Tyne are Ponteland West at an average of £597,252, Ponteland South With Heddon at an average of £567,930 and Ponteland North at an average of £495,666.
What locations have the most affordable properties for sale in Newcastle Upon Tyne?
The locations with the most affordable properties for sale in Newcastle Upon Tyne are Bellingham at an average of £284,351, South Tynedale at an average of £316,000 and Bywell at an average of £371,294.
Which train stations are available in or near Newcastle Upon Tyne?
Some of the train stations available in or near Newcastle Upon Tyne are Wylam, Prudhoe and Stocksfield.
Property Price Paid in Newcastle Upon Tyne by Year
The average sold property price by year was:
| Year | Average Sold Price | Price Change |
Sold Properties
|
|---|---|---|---|
| 2024 | £333,854 | -51% |
21 Properties |
| 2023 | £502,664 | -2% |
213 Properties |
| 2022 | £511,951 | 2% |
288 Properties |
| 2021 | £500,300 | 13% |
379 Properties |
| 2020 | £435,108 | 16% |
344 Properties |
| 2019 | £365,990 | -6% |
296 Properties |
| 2018 | £386,283 | -2% |
290 Properties |
| 2017 | £393,264 | 7% |
289 Properties |
| 2016 | £365,230 | -2% |
317 Properties |
| 2015 | £373,298 | 7% |
325 Properties |
| 2014 | £346,902 | 2% |
287 Properties |
| 2013 | £339,128 | 8% |
242 Properties |
| 2012 | £313,274 | -8% |
210 Properties |
| 2011 | £337,517 | 1% |
183 Properties |
| 2010 | £332,470 | 9% |
215 Properties |
| 2009 | £301,978 | -25% |
165 Properties |
| 2008 | £376,597 | -4% |
181 Properties |
| 2007 | £392,924 | 14% |
346 Properties |
| 2006 | £339,004 | 1% |
317 Properties |
| 2005 | £334,678 | 4% |
239 Properties |
| 2004 | £320,943 | 17% |
304 Properties |
| 2003 | £266,257 | 18% |
314 Properties |
| 2002 | £218,856 | 17% |
362 Properties |
| 2001 | £181,777 | 5% |
325 Properties |
| 2000 | £173,065 | 17% |
315 Properties |
| 1999 | £143,926 | 2% |
341 Properties |
| 1998 | £140,357 | 8% |
238 Properties |
| 1997 | £129,513 | 4% |
327 Properties |
| 1996 | £123,796 | 1% |
300 Properties |
| 1995 | £122,655 | - |
259 Properties |
Property Price per Property Type in Newcastle Upon Tyne
Here you can find historic sold price data in order to help with your property search.
The average Property Paid Price for specific property types in the last three years are:
| Property Type | Average Sold Price | Sold Properties |
|---|---|---|
| Semi Detached House | £311,319.00 | 185 Semi Detached Houses |
| Terraced House | £291,643.00 | 93 Terraced Houses |
| Detached House | £671,314.00 | 519 Detached Houses |
| Flat | £173,124.00 | 104 Flats |