
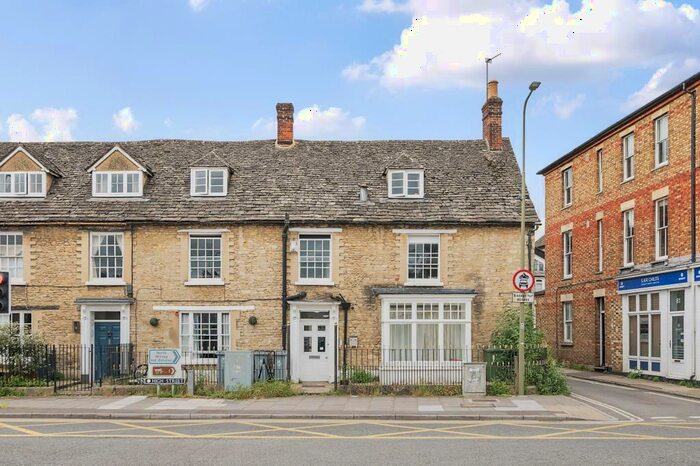
Houses for sale & to rent in Witney, Oxfordshire
House Prices in Witney
Properties in Witney have an average house price of £409,768.00 and had 2,603 Property Transactions within the last 3 years.¹
Witney is an area in Oxfordshire with 20,818 households², where the most expensive property was sold for £3,500,000.00.
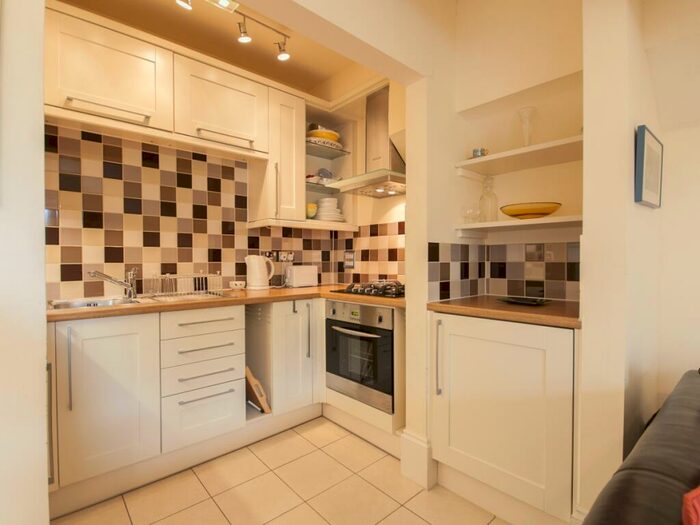
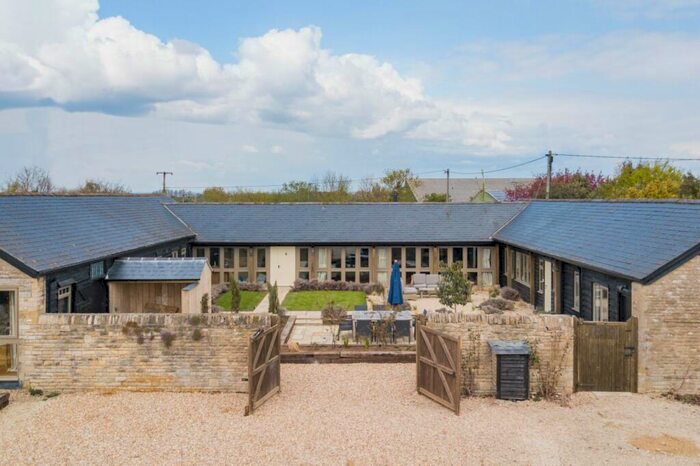
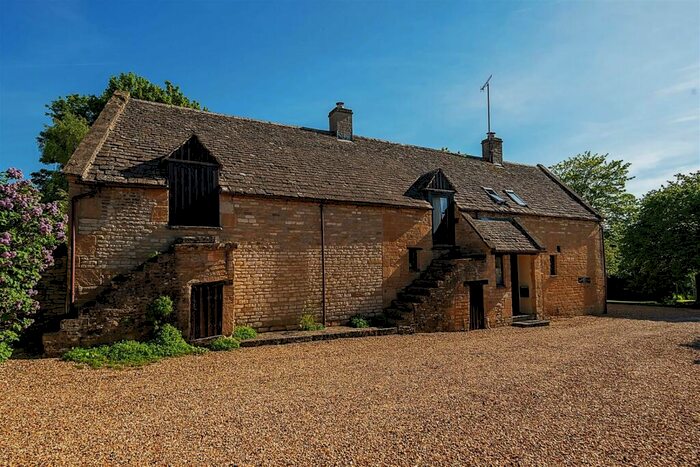
Properties for sale in Witney


Neighbourhoods in Witney
Navigate through our locations to find the location of your next house in Witney, Oxfordshire for sale or to rent.
- Appleton And Cumnor
- Brize Norton And Shilton
- Ducklington
- Eynsham And Cassington
- Freeland And Hanborough
- Hailey, Minster Lovell And Leafield
- North Leigh
- Standlake, Aston And Stanton Harcourt
- Stonesfield And Tackley
- Witney Central
- Witney East
- Witney North
- Witney South
- Witney West
- Cumnor
- Kidlington West
Transport in Witney
Please see below transportation links in this area:

- FAQ
- Price Paid By Year
- Property Type Price
Frequently asked questions about Witney
What is the average price for a property for sale in Witney?
The average price for a property for sale in Witney is £409,768. This amount is 15% lower than the average price in Oxfordshire. There are 9,101 property listings for sale in Witney.
What locations have the most expensive properties for sale in Witney?
The locations with the most expensive properties for sale in Witney are Standlake, Aston And Stanton Harcourt at an average of £610,782, Brize Norton And Shilton at an average of £573,083 and Stonesfield And Tackley at an average of £524,719.
What locations have the most affordable properties for sale in Witney?
The locations with the most affordable properties for sale in Witney are Witney South at an average of £312,831, Witney East at an average of £334,927 and Witney West at an average of £342,215.
Which train stations are available in or near Witney?
Some of the train stations available in or near Witney are Combe, Finstock and Hanborough.
Property Price Paid in Witney by Year
The average sold property price by year was:
| Year | Average Sold Price | Price Change |
Sold Properties
|
|---|---|---|---|
| 2024 | £345,125 | -19% |
38 Properties |
| 2023 | £409,089 | -4% |
583 Properties |
| 2022 | £424,460 | 5% |
801 Properties |
| 2021 | £402,220 | 4% |
1,181 Properties |
| 2020 | £384,725 | 2% |
876 Properties |
| 2019 | £375,303 | -1% |
995 Properties |
| 2018 | £377,976 | 2% |
935 Properties |
| 2017 | £370,587 | 5% |
842 Properties |
| 2016 | £352,151 | 10% |
887 Properties |
| 2015 | £316,316 | 4% |
930 Properties |
| 2014 | £302,328 | 7% |
963 Properties |
| 2013 | £281,130 | 1% |
820 Properties |
| 2012 | £278,563 | 3% |
667 Properties |
| 2011 | £271,131 | 6% |
763 Properties |
| 2010 | £255,677 | 7% |
791 Properties |
| 2009 | £237,867 | -1% |
749 Properties |
| 2008 | £241,405 | -10% |
713 Properties |
| 2007 | £264,999 | 7% |
1,157 Properties |
| 2006 | £247,682 | 8% |
1,447 Properties |
| 2005 | £227,882 | -2% |
1,060 Properties |
| 2004 | £231,424 | 7% |
1,083 Properties |
| 2003 | £214,202 | 12% |
1,122 Properties |
| 2002 | £188,331 | 15% |
1,241 Properties |
| 2001 | £159,957 | 6% |
1,159 Properties |
| 2000 | £149,818 | 18% |
909 Properties |
| 1999 | £122,822 | 10% |
1,053 Properties |
| 1998 | £110,417 | 7% |
999 Properties |
| 1997 | £102,227 | 16% |
984 Properties |
| 1996 | £86,055 | 3% |
1,042 Properties |
| 1995 | £83,532 | - |
713 Properties |
Property Price per Property Type in Witney
Here you can find historic sold price data in order to help with your property search.
The average Property Paid Price for specific property types in the last three years are:
| Property Type | Average Sold Price | Sold Properties |
|---|---|---|
| Terraced House | £328,948.00 | 669 Terraced Houses |
| Flat | £214,750.00 | 372 Flats |
| Semi Detached House | £368,405.00 | 734 Semi Detached Houses |
| Detached House | £599,354.00 | 828 Detached Houses |