
Houses for sale & to rent in Saltburn-by-the-sea, Redcar and Cleveland
House Prices in Saltburn-by-the-sea
Properties in Saltburn-by-the-sea have an average house price of £155,576.00 and had 1,604 Property Transactions within the last 3 years.¹
Saltburn-by-the-sea is an area in Redcar and Cleveland with 13,455 households², where the most expensive property was sold for £920,000.00.
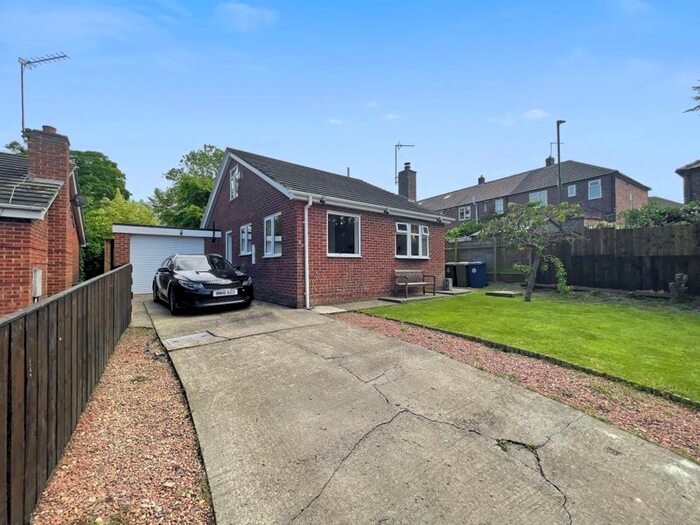
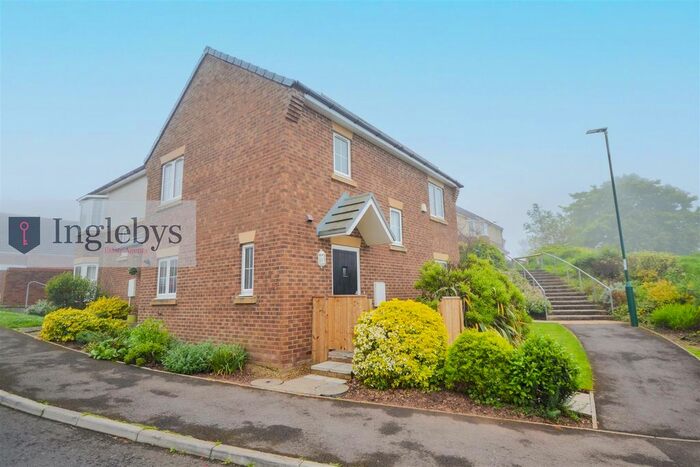
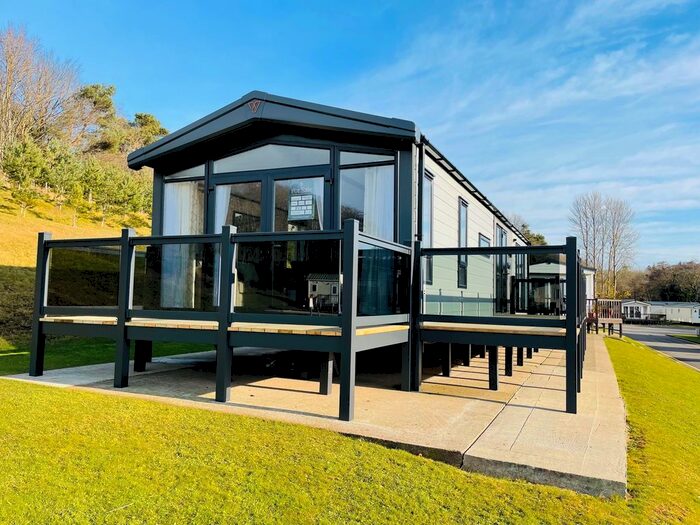
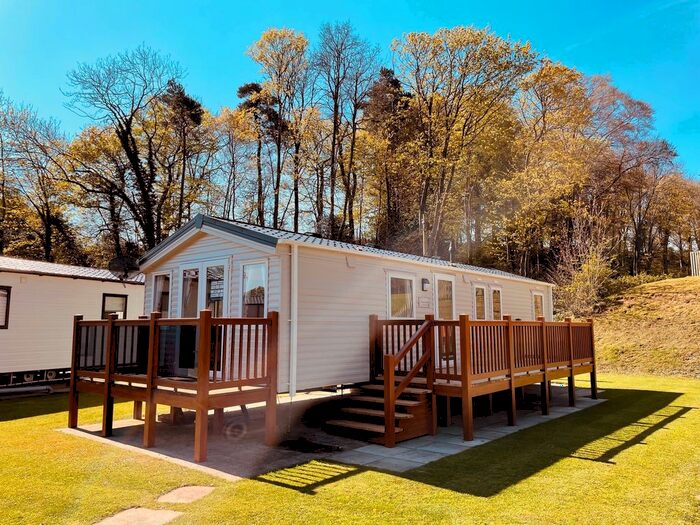
Properties for sale in Saltburn-by-the-sea


Neighbourhoods in Saltburn-by-the-sea
Navigate through our locations to find the location of your next house in Saltburn-by-the-sea, Redcar and Cleveland for sale or to rent.
Transport in Saltburn-by-the-sea
Please see below transportation links in this area:

- FAQ
- Price Paid By Year
- Property Type Price
Frequently asked questions about Saltburn-by-the-sea
What is the average price for a property for sale in Saltburn-by-the-sea?
The average price for a property for sale in Saltburn-by-the-sea is £155,576. This amount is 0.25% higher than the average price in Redcar and Cleveland. There are 1,670 property listings for sale in Saltburn-by-the-sea.
What locations have the most expensive properties for sale in Saltburn-by-the-sea?
The locations with the most expensive properties for sale in Saltburn-by-the-sea are Skelton West at an average of £325,000, Saltburn at an average of £241,608 and Skelton East at an average of £161,332.
What locations have the most affordable properties for sale in Saltburn-by-the-sea?
The locations with the most affordable properties for sale in Saltburn-by-the-sea are Westworth at an average of £111,033, Brotton at an average of £116,364 and Loftus at an average of £121,508.
Which train stations are available in or near Saltburn-by-the-sea?
Some of the train stations available in or near Saltburn-by-the-sea are Saltburn, Marske and Longbeck.
Property Price Paid in Saltburn-by-the-sea by Year
The average sold property price by year was:
| Year | Average Sold Price | Price Change |
Sold Properties
|
|---|---|---|---|
| 2024 | £153,153 | -0,4% |
32 Properties |
| 2023 | £153,746 | -6% |
407 Properties |
| 2022 | £163,382 | 8% |
526 Properties |
| 2021 | £150,439 | 15% |
639 Properties |
| 2020 | £128,514 | -10% |
462 Properties |
| 2019 | £140,944 | 7% |
562 Properties |
| 2018 | £131,569 | 3% |
491 Properties |
| 2017 | £128,028 | 1% |
530 Properties |
| 2016 | £126,527 | -2% |
423 Properties |
| 2015 | £129,024 | 0,4% |
407 Properties |
| 2014 | £128,550 | -2% |
488 Properties |
| 2013 | £130,741 | 6% |
392 Properties |
| 2012 | £123,416 | 0,3% |
307 Properties |
| 2011 | £123,016 | -5% |
322 Properties |
| 2010 | £128,768 | -4% |
300 Properties |
| 2009 | £133,580 | 8% |
307 Properties |
| 2008 | £122,422 | -8% |
369 Properties |
| 2007 | £132,524 | 9% |
713 Properties |
| 2006 | £121,231 | 3% |
797 Properties |
| 2005 | £117,275 | 15% |
604 Properties |
| 2004 | £99,547 | 26% |
823 Properties |
| 2003 | £73,565 | 18% |
901 Properties |
| 2002 | £60,158 | 14% |
872 Properties |
| 2001 | £51,552 | 1% |
617 Properties |
| 2000 | £51,153 | 1% |
481 Properties |
| 1999 | £50,819 | 11% |
418 Properties |
| 1998 | £44,982 | 3% |
451 Properties |
| 1997 | £43,756 | -5% |
481 Properties |
| 1996 | £46,103 | -1% |
543 Properties |
| 1995 | £46,596 | - |
423 Properties |
Property Price per Property Type in Saltburn-by-the-sea
Here you can find historic sold price data in order to help with your property search.
The average Property Paid Price for specific property types in the last three years are:
| Property Type | Average Sold Price | Sold Properties |
|---|---|---|
| Terraced House | £106,193.00 | 779 Terraced Houses |
| Flat | £143,678.00 | 120 Flats |
| Semi Detached House | £164,638.00 | 424 Semi Detached Houses |
| Detached House | £283,886.00 | 281 Detached Houses |