
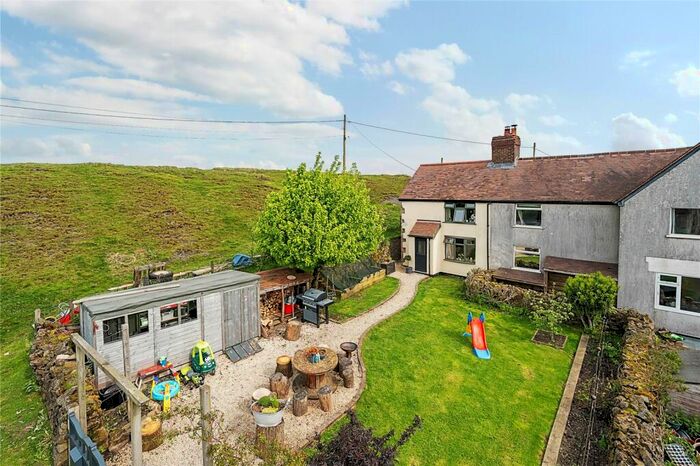
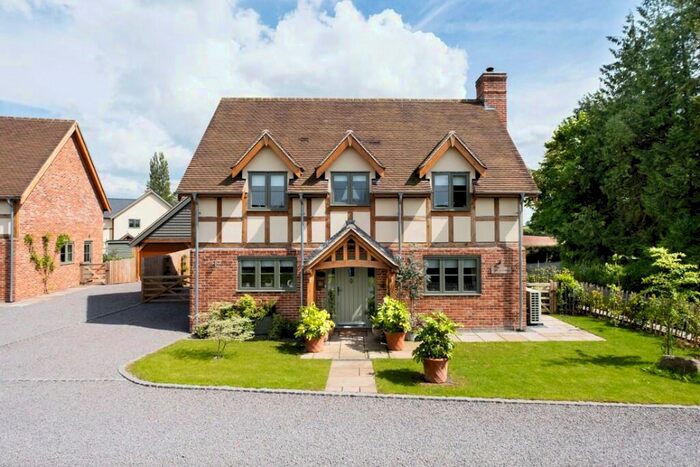
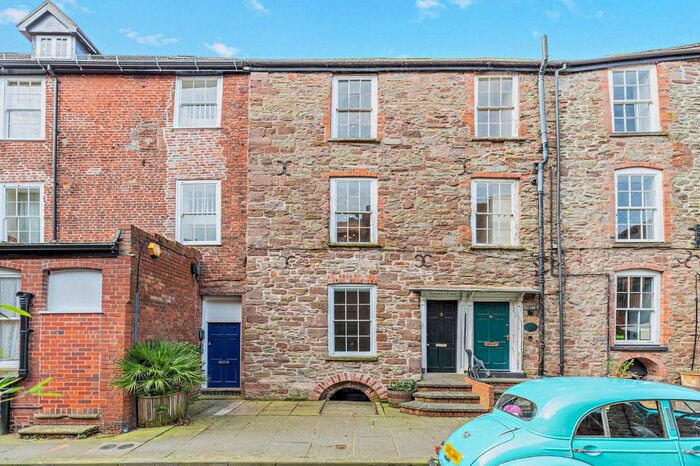
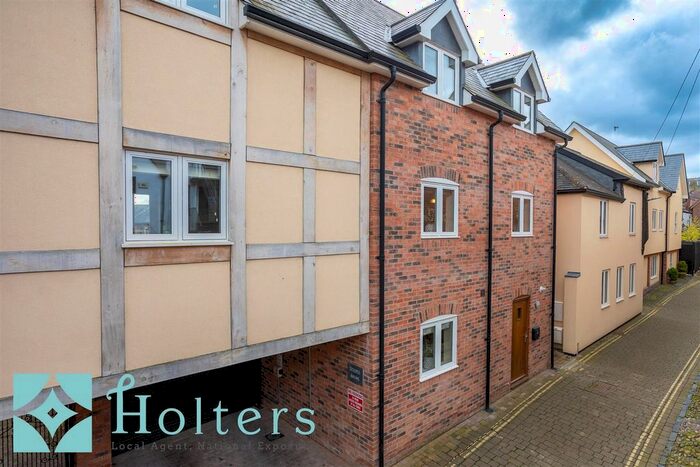
Houses for sale & to rent in Ludlow, Shropshire
House Prices in Ludlow
Properties in Ludlow have an average house price of £294,329.00 and had 825 Property Transactions within the last 3 years.¹
Ludlow is an area in Shropshire with 7,398 households², where the most expensive property was sold for £1,825,000.00.
Properties for sale in Ludlow


Neighbourhoods in Ludlow
Navigate through our locations to find the location of your next house in Ludlow, Shropshire for sale or to rent.
Transport in Ludlow
Please see below transportation links in this area:

- FAQ
- Price Paid By Year
- Property Type Price
Frequently asked questions about Ludlow
What is the average price for a property for sale in Ludlow?
The average price for a property for sale in Ludlow is £294,329. This amount is 1% lower than the average price in Shropshire. There are 1,044 property listings for sale in Ludlow.
What locations have the most expensive properties for sale in Ludlow?
The locations with the most expensive properties for sale in Ludlow are Corvedale at an average of £519,042, Cleobury Mortimer at an average of £383,933 and Clee at an average of £354,840.
What locations have the most affordable properties for sale in Ludlow?
The locations with the most affordable properties for sale in Ludlow are Ludlow East at an average of £239,296, Ludlow South at an average of £281,980 and Ludlow North at an average of £285,998.
Which train stations are available in or near Ludlow?
Some of the train stations available in or near Ludlow are Ludlow, Craven Arms and Broome.
Property Price Paid in Ludlow by Year
The average sold property price by year was:
| Year | Average Sold Price | Price Change |
Sold Properties
|
|---|---|---|---|
| 2024 | £319,300 | 7% |
20 Properties |
| 2023 | £295,669 | -3% |
191 Properties |
| 2022 | £303,276 | 6% |
264 Properties |
| 2021 | £285,423 | -3% |
350 Properties |
| 2020 | £294,896 | 17% |
204 Properties |
| 2019 | £245,903 | -1% |
273 Properties |
| 2018 | £249,087 | 5% |
276 Properties |
| 2017 | £237,241 | 1% |
297 Properties |
| 2016 | £234,488 | 8% |
285 Properties |
| 2015 | £215,977 | -3% |
266 Properties |
| 2014 | £221,386 | 3% |
271 Properties |
| 2013 | £214,760 | 6% |
248 Properties |
| 2012 | £202,569 | -6% |
245 Properties |
| 2011 | £213,867 | 1% |
220 Properties |
| 2010 | £210,895 | 1% |
240 Properties |
| 2009 | £209,051 | -1% |
212 Properties |
| 2008 | £210,544 | -8% |
194 Properties |
| 2007 | £228,101 | 12% |
316 Properties |
| 2006 | £200,006 | -1% |
409 Properties |
| 2005 | £202,039 | 7% |
267 Properties |
| 2004 | £187,105 | 13% |
309 Properties |
| 2003 | £161,847 | 17% |
398 Properties |
| 2002 | £133,878 | 13% |
452 Properties |
| 2001 | £116,934 | 19% |
407 Properties |
| 2000 | £94,360 | 10% |
367 Properties |
| 1999 | £84,934 | 2% |
425 Properties |
| 1998 | £83,098 | 13% |
361 Properties |
| 1997 | £72,686 | 10% |
331 Properties |
| 1996 | £65,242 | 2% |
336 Properties |
| 1995 | £63,702 | - |
254 Properties |
Property Price per Property Type in Ludlow
Here you can find historic sold price data in order to help with your property search.
The average Property Paid Price for specific property types in the last three years are:
| Property Type | Average Sold Price | Sold Properties |
|---|---|---|
| Semi Detached House | £238,689.00 | 182 Semi Detached Houses |
| Terraced House | £262,765.00 | 250 Terraced Houses |
| Detached House | £408,747.00 | 290 Detached Houses |
| Flat | £147,112.00 | 103 Flats |