
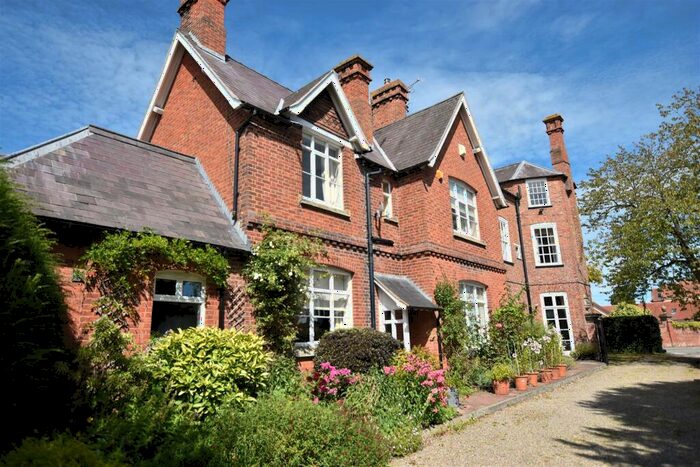
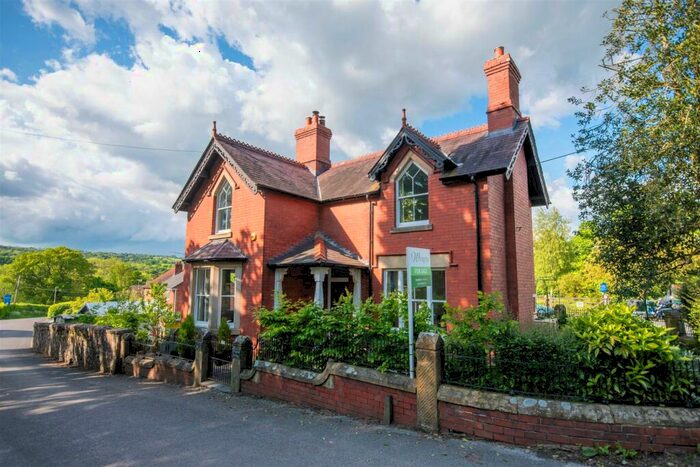
Houses for sale & to rent in Oswestry, Shropshire
House Prices in Oswestry
Properties in Oswestry have an average house price of £255,827.00 and had 1,797 Property Transactions within the last 3 years.¹
Oswestry is an area in Shropshire with 16,221 households², where the most expensive property was sold for £2,250,000.00.
Properties for sale in Oswestry


Neighbourhoods in Oswestry
Navigate through our locations to find the location of your next house in Oswestry, Shropshire for sale or to rent.
Transport in Oswestry
Please see below transportation links in this area:

- FAQ
- Price Paid By Year
- Property Type Price
Frequently asked questions about Oswestry
What is the average price for a property for sale in Oswestry?
The average price for a property for sale in Oswestry is £255,827. This amount is 15% lower than the average price in Shropshire. There are 2,743 property listings for sale in Oswestry.
What locations have the most expensive properties for sale in Oswestry?
The locations with the most expensive properties for sale in Oswestry are The Meres at an average of £487,425, Llanymynech at an average of £396,878 and St Oswald at an average of £308,492.
What locations have the most affordable properties for sale in Oswestry?
The locations with the most affordable properties for sale in Oswestry are Oswestry West at an average of £196,054, Oswestry East at an average of £198,146 and Oswestry South at an average of £219,725.
Which train stations are available in or near Oswestry?
Some of the train stations available in or near Oswestry are Gobowen, Chirk and Ruabon.
Property Price Paid in Oswestry by Year
The average sold property price by year was:
| Year | Average Sold Price | Price Change |
Sold Properties
|
|---|---|---|---|
| 2024 | £230,964 | -13% |
44 Properties |
| 2023 | £261,053 | -0,4% |
412 Properties |
| 2022 | £262,116 | 5% |
558 Properties |
| 2021 | £249,994 | 9% |
783 Properties |
| 2020 | £226,693 | 10% |
652 Properties |
| 2019 | £203,768 | 1% |
627 Properties |
| 2018 | £202,120 | 1% |
580 Properties |
| 2017 | £200,010 | 5% |
661 Properties |
| 2016 | £190,439 | 4% |
639 Properties |
| 2015 | £182,943 | 5% |
678 Properties |
| 2014 | £174,545 | 1% |
564 Properties |
| 2013 | £172,228 | 2% |
508 Properties |
| 2012 | £169,025 | -9% |
398 Properties |
| 2011 | £184,393 | 2% |
384 Properties |
| 2010 | £179,870 | 4% |
416 Properties |
| 2009 | £172,976 | -4% |
446 Properties |
| 2008 | £180,119 | -5% |
379 Properties |
| 2007 | £189,596 | 7% |
883 Properties |
| 2006 | £177,144 | 8% |
912 Properties |
| 2005 | £162,629 | 2% |
658 Properties |
| 2004 | £158,943 | 18% |
826 Properties |
| 2003 | £130,058 | 23% |
871 Properties |
| 2002 | £99,960 | 16% |
884 Properties |
| 2001 | £84,025 | 12% |
864 Properties |
| 2000 | £74,333 | 9% |
781 Properties |
| 1999 | £67,791 | 12% |
825 Properties |
| 1998 | £59,623 | 5% |
665 Properties |
| 1997 | £56,711 | 0,1% |
746 Properties |
| 1996 | £56,632 | 7% |
716 Properties |
| 1995 | £52,889 | - |
583 Properties |
Property Price per Property Type in Oswestry
Here you can find historic sold price data in order to help with your property search.
The average Property Paid Price for specific property types in the last three years are:
| Property Type | Average Sold Price | Sold Properties |
|---|---|---|
| Terraced House | £167,311.00 | 393 Terraced Houses |
| Flat | £109,104.00 | 91 Flats |
| Semi Detached House | £197,855.00 | 520 Semi Detached Houses |
| Detached House | £354,546.00 | 793 Detached Houses |