
Houses for sale & to rent in Shrewsbury, Shropshire
House Prices in Shrewsbury
Properties in Shrewsbury have an average house price of £296,334.00 and had 6,249 Property Transactions within the last 3 years.¹
Shrewsbury is an area in Shropshire with 51,391 households², where the most expensive property was sold for £2,050,000.00.
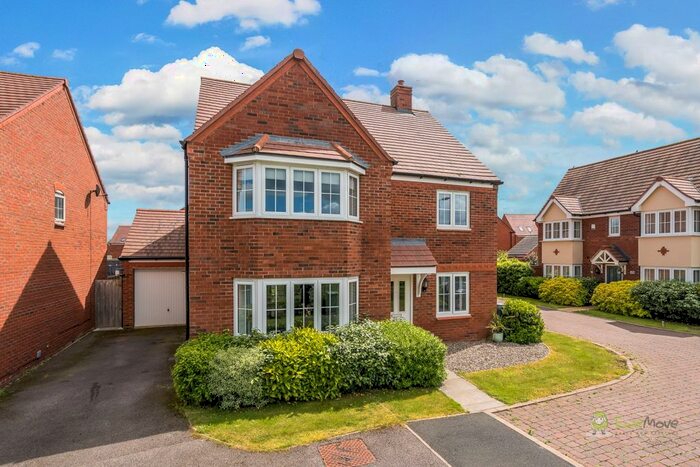
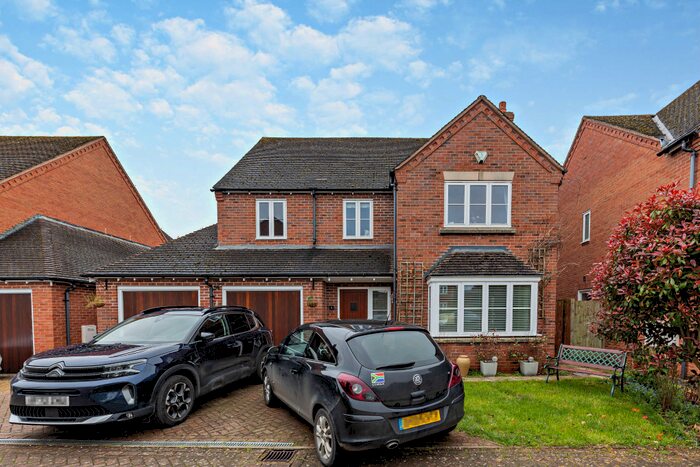
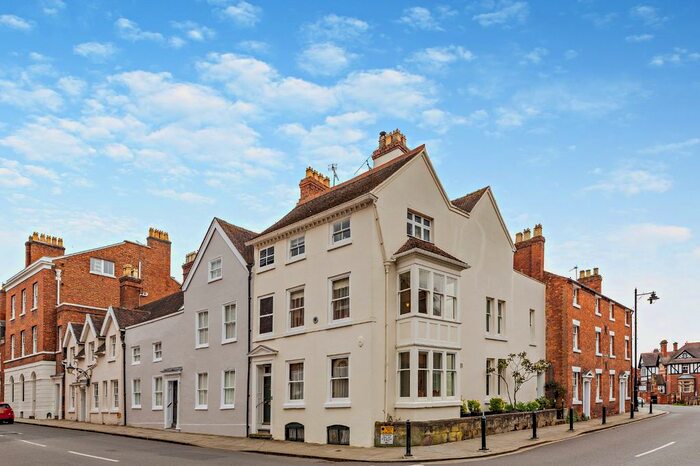
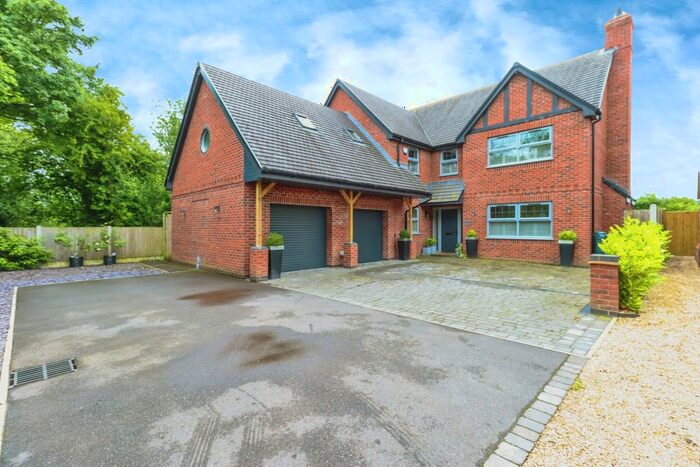
Properties for sale in Shrewsbury


Neighbourhoods in Shrewsbury
Navigate through our locations to find the location of your next house in Shrewsbury, Shropshire for sale or to rent.
- Abbey
- Bagley
- Battlefield
- Bayston Hill, Column And Sutton
- Belle Vue
- Bishops Castle
- Bowbrook
- Burnell
- Castlefields And Ditherington
- Chirbury And Worthen
- Copthorne
- Harlescott
- Hodnet
- Llanymynech
- Longden
- Loton
- Meole
- Monkmoor
- Porthill
- Prees
- Quarry And Coton Hill
- Radbrook
- Rea Valley
- Ruyton And Baschurch
- Severn Valley
- Shawbury
- Sundorne
- Tern
- The Meres
- Underdale
- Wem
Transport in Shrewsbury
Please see below transportation links in this area:

- FAQ
- Price Paid By Year
- Property Type Price
Frequently asked questions about Shrewsbury
What is the average price for a property for sale in Shrewsbury?
The average price for a property for sale in Shrewsbury is £296,334. This amount is 0.44% lower than the average price in Shropshire. There are 9,555 property listings for sale in Shrewsbury.
What locations have the most expensive properties for sale in Shrewsbury?
The locations with the most expensive properties for sale in Shrewsbury are Bishops Castle at an average of £552,500, Hodnet at an average of £525,128 and Loton at an average of £418,976.
What locations have the most affordable properties for sale in Shrewsbury?
The locations with the most affordable properties for sale in Shrewsbury are Harlescott at an average of £192,221, Sundorne at an average of £199,701 and Castlefields And Ditherington at an average of £203,776.
Which train stations are available in or near Shrewsbury?
Some of the train stations available in or near Shrewsbury are Shrewsbury, Yorton and Wem.
Property Price Paid in Shrewsbury by Year
The average sold property price by year was:
| Year | Average Sold Price | Price Change |
Sold Properties
|
|---|---|---|---|
| 2024 | £288,018 | -5% |
115 Properties |
| 2023 | £302,799 | 1% |
1,410 Properties |
| 2022 | £300,412 | 3% |
1,966 Properties |
| 2021 | £290,467 | 9% |
2,758 Properties |
| 2020 | £264,449 | 3% |
2,041 Properties |
| 2019 | £257,616 | 5% |
2,593 Properties |
| 2018 | £244,418 | 3% |
2,615 Properties |
| 2017 | £237,207 | 3% |
2,562 Properties |
| 2016 | £229,847 | 6% |
2,449 Properties |
| 2015 | £216,347 | 3% |
2,390 Properties |
| 2014 | £209,101 | 6% |
2,148 Properties |
| 2013 | £195,709 | -0,2% |
1,766 Properties |
| 2012 | £196,155 | -1% |
1,400 Properties |
| 2011 | £198,581 | -4% |
1,315 Properties |
| 2010 | £206,015 | 5% |
1,466 Properties |
| 2009 | £195,806 | -6% |
1,384 Properties |
| 2008 | £208,025 | -0,3% |
1,109 Properties |
| 2007 | £208,740 | 7% |
2,239 Properties |
| 2006 | £193,295 | 6% |
2,865 Properties |
| 2005 | £182,656 | 6% |
2,048 Properties |
| 2004 | £171,160 | 14% |
2,505 Properties |
| 2003 | £146,966 | 17% |
2,381 Properties |
| 2002 | £121,333 | 16% |
2,793 Properties |
| 2001 | £101,812 | 12% |
2,709 Properties |
| 2000 | £89,239 | 13% |
2,441 Properties |
| 1999 | £77,748 | 4% |
2,874 Properties |
| 1998 | £74,915 | 7% |
2,389 Properties |
| 1997 | £69,785 | 6% |
2,541 Properties |
| 1996 | £65,276 | 2% |
2,447 Properties |
| 1995 | £63,928 | - |
1,840 Properties |
Property Price per Property Type in Shrewsbury
Here you can find historic sold price data in order to help with your property search.
The average Property Paid Price for specific property types in the last three years are:
| Property Type | Average Sold Price | Sold Properties |
|---|---|---|
| Terraced House | £224,147.00 | 1,359 Terraced Houses |
| Flat | £167,355.00 | 656 Flats |
| Semi Detached House | £254,568.00 | 2,003 Semi Detached Houses |
| Detached House | £415,728.00 | 2,231 Detached Houses |