
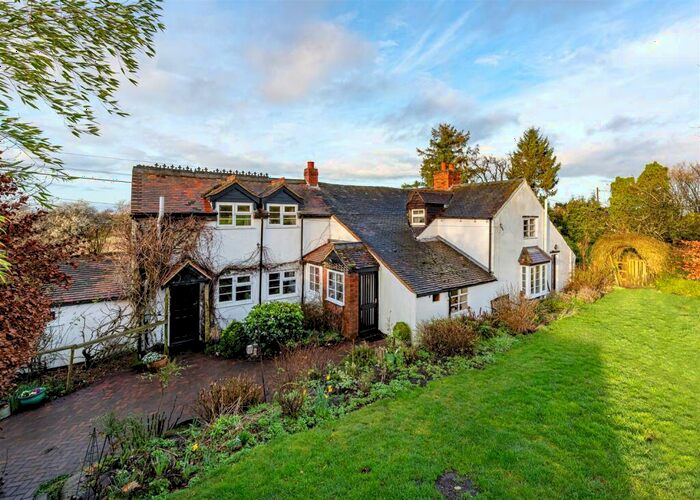
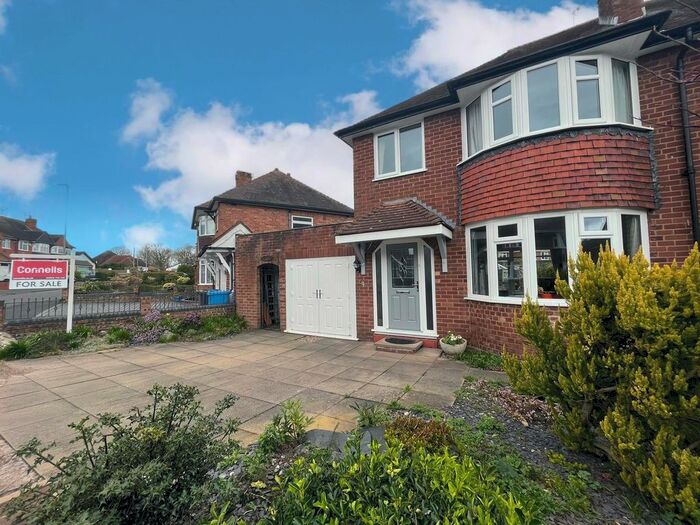
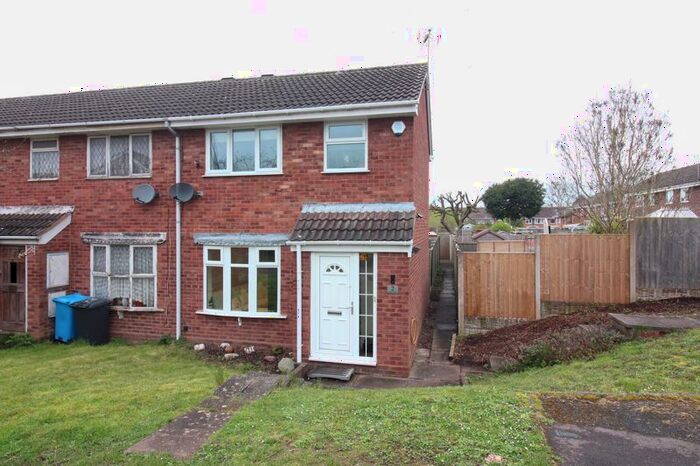
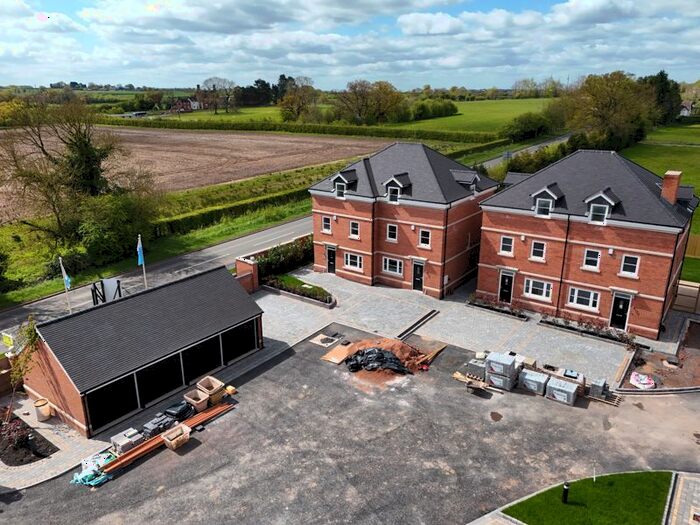
Houses for sale & to rent in Wolverhampton, Shropshire
House Prices in Wolverhampton
Properties in Wolverhampton have an average house price of £375,709.00 and had 323 Property Transactions within the last 3 years.¹
Wolverhampton is an area in Shropshire with 3,354 households², where the most expensive property was sold for £2,487,500.00.
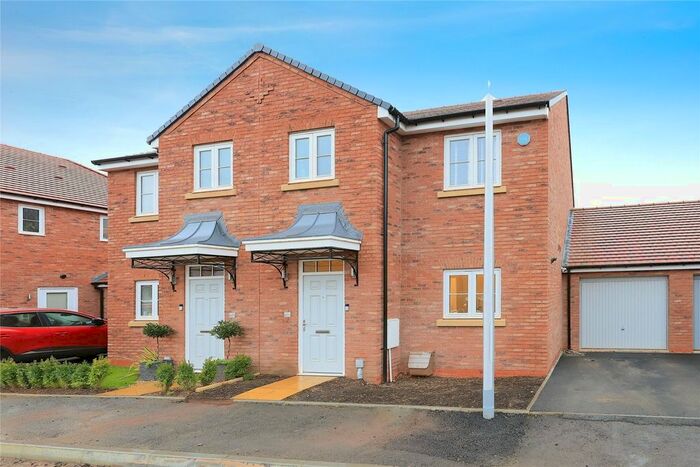
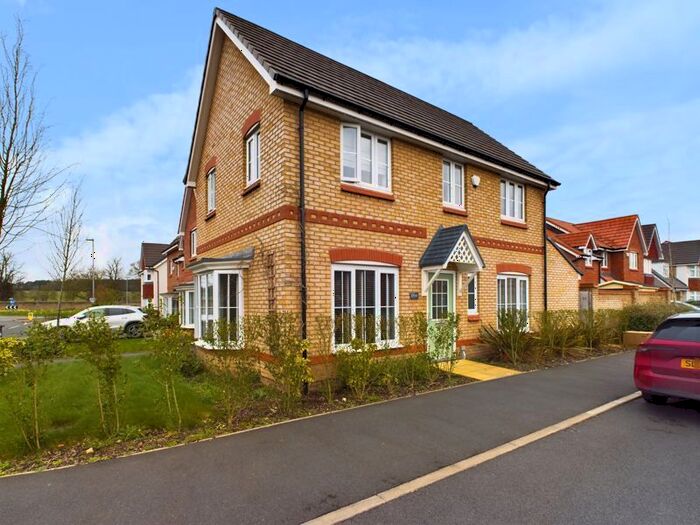
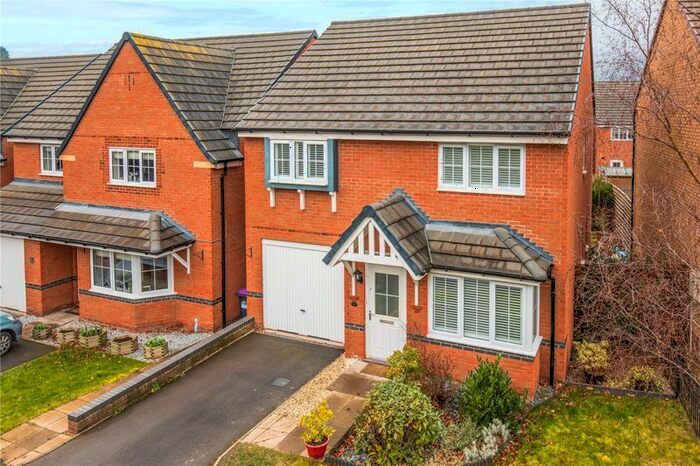
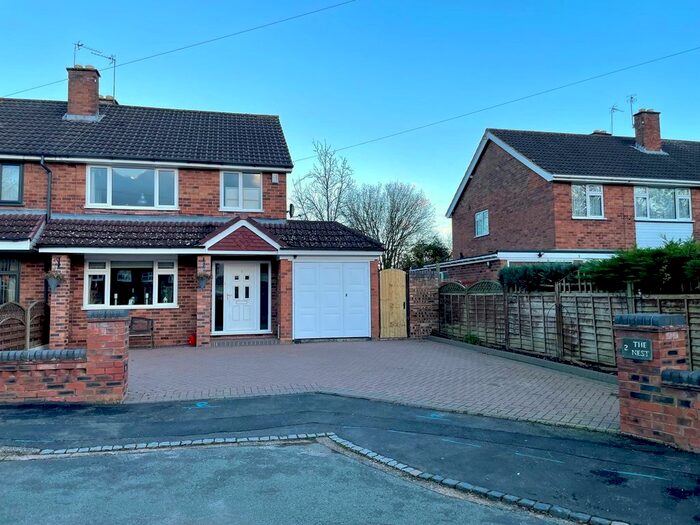
Properties for sale in Wolverhampton


Neighbourhoods in Wolverhampton
Navigate through our locations to find the location of your next house in Wolverhampton, Shropshire for sale or to rent.
Transport in Wolverhampton
Please see below transportation links in this area:

- FAQ
- Price Paid By Year
- Property Type Price
Frequently asked questions about Wolverhampton
What is the average price for a property for sale in Wolverhampton?
The average price for a property for sale in Wolverhampton is £375,709. This amount is 23% higher than the average price in Shropshire. There are 1,357 property listings for sale in Wolverhampton.
What locations have the most expensive properties for sale in Wolverhampton?
The locations with the most expensive properties for sale in Wolverhampton are Worfield at an average of £638,978 and Alveley And Claverley at an average of £497,883.
What locations have the most affordable properties for sale in Wolverhampton?
The locations with the most affordable properties for sale in Wolverhampton are Albrighton at an average of £311,288 and Shifnal South And Cosford at an average of £387,193.
Which train stations are available in or near Wolverhampton?
Some of the train stations available in or near Wolverhampton are Albrighton, Cosford and Codsall.
Property Price Paid in Wolverhampton by Year
The average sold property price by year was:
| Year | Average Sold Price | Price Change |
Sold Properties
|
|---|---|---|---|
| 2024 | £336,000 | -16% |
5 Properties |
| 2023 | £391,185 | 3% |
59 Properties |
| 2022 | £380,894 | 4% |
108 Properties |
| 2021 | £367,269 | 14% |
151 Properties |
| 2020 | £317,337 | 7% |
121 Properties |
| 2019 | £294,505 | 1% |
92 Properties |
| 2018 | £292,863 | -2% |
105 Properties |
| 2017 | £297,756 | 8% |
109 Properties |
| 2016 | £275,040 | 9% |
99 Properties |
| 2015 | £249,107 | -4% |
77 Properties |
| 2014 | £258,051 | 4% |
105 Properties |
| 2013 | £246,874 | 5% |
85 Properties |
| 2012 | £234,932 | 5% |
56 Properties |
| 2011 | £224,113 | -5% |
52 Properties |
| 2010 | £235,798 | -9% |
55 Properties |
| 2009 | £257,058 | -1% |
51 Properties |
| 2008 | £258,533 | -5% |
57 Properties |
| 2007 | £272,325 | 11% |
114 Properties |
| 2006 | £242,451 | 4% |
105 Properties |
| 2005 | £232,070 | 7% |
99 Properties |
| 2004 | £214,928 | 13% |
98 Properties |
| 2003 | £187,367 | 22% |
109 Properties |
| 2002 | £146,395 | 7% |
111 Properties |
| 2001 | £136,379 | 15% |
123 Properties |
| 2000 | £116,494 | -0,3% |
129 Properties |
| 1999 | £116,821 | 1% |
89 Properties |
| 1998 | £115,779 | 12% |
95 Properties |
| 1997 | £101,350 | 13% |
132 Properties |
| 1996 | £87,673 | -15% |
120 Properties |
| 1995 | £100,723 | - |
101 Properties |
Property Price per Property Type in Wolverhampton
Here you can find historic sold price data in order to help with your property search.
The average Property Paid Price for specific property types in the last three years are:
| Property Type | Average Sold Price | Sold Properties |
|---|---|---|
| Flat | £209,556.00 | 15 Flats |
| Semi Detached House | £286,304.00 | 98 Semi Detached Houses |
| Detached House | £502,834.00 | 133 Detached Houses |
| Terraced House | £302,287.00 | 77 Terraced Houses |