
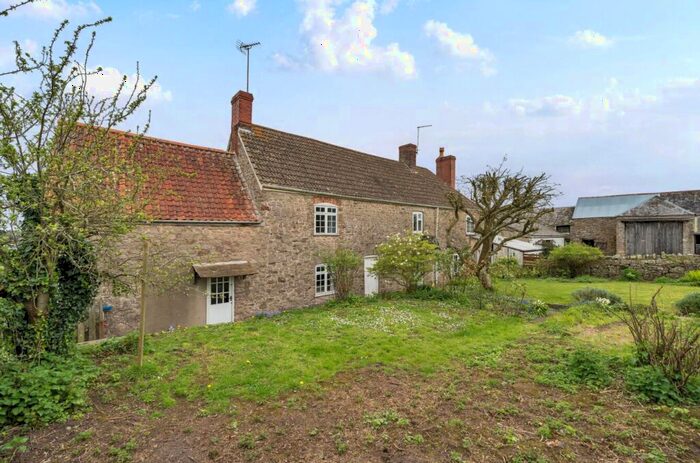
Houses for sale & to rent in Wotton-under-edge, South Gloucestershire
House Prices in Wotton-under-edge
Properties in Wotton-under-edge have an average house price of £431,301.00 and had 242 Property Transactions within the last 3 years.¹
Wotton-under-edge is an area in South Gloucestershire with 2,496 households², where the most expensive property was sold for £1,400,000.00.
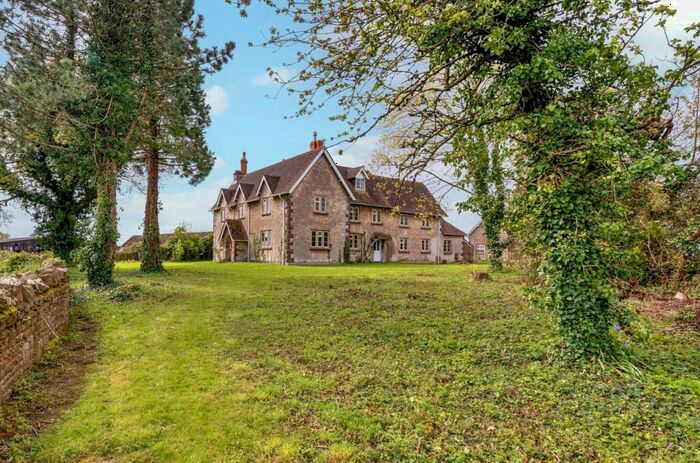
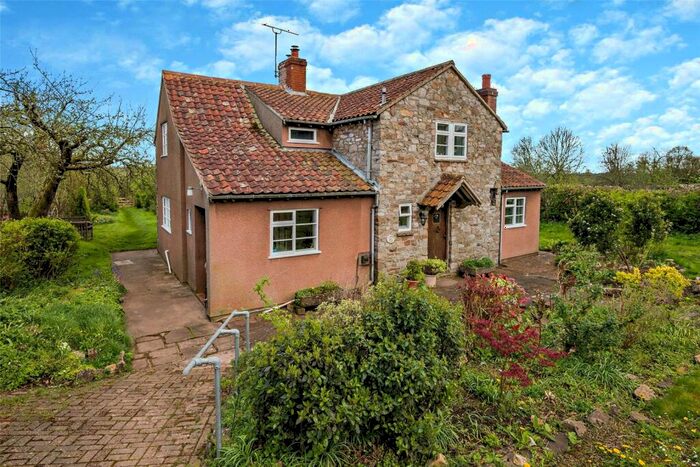
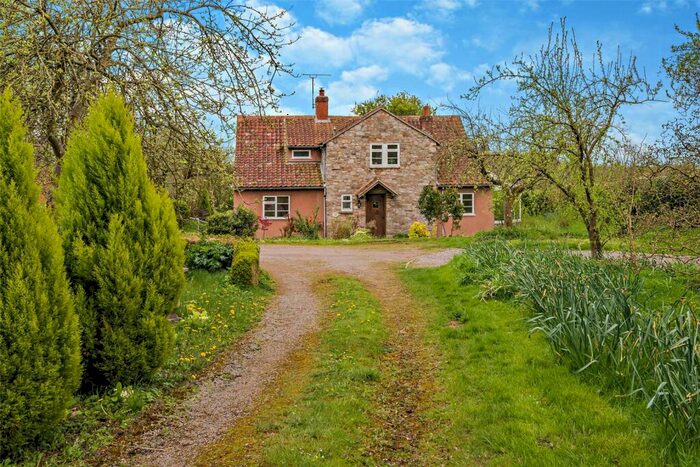
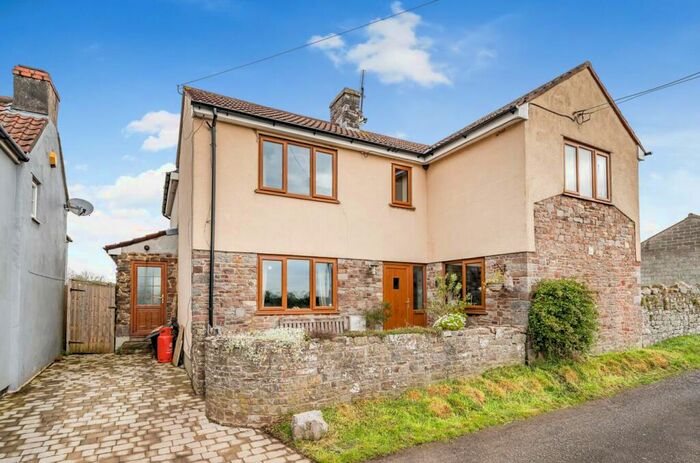
Properties for sale in Wotton-under-edge


Neighbourhoods in Wotton-under-edge
Navigate through our locations to find the location of your next house in Wotton-under-edge, South Gloucestershire for sale or to rent.
Transport in Wotton-under-edge
Please see below transportation links in this area:
-
 Yate Station
 -
Cam and Dursley Station
-
Lydney Station
-
Patchway Station
-
Bristol Parkway Station
-
Pilning Station
-
Filton Abbey Wood Station
- FAQ
- Price Paid By Year
- Property Type Price
Frequently asked questions about Wotton-under-edge
What is the average price for a property for sale in Wotton-under-edge?
The average price for a property for sale in Wotton-under-edge is £431,301. This amount is 23% higher than the average price in South Gloucestershire. There are 1,272 property listings for sale in Wotton-under-edge.
What locations have the most expensive properties for sale in Wotton-under-edge?
The locations with the most expensive properties for sale in Wotton-under-edge are Chipping Sodbury & Cotswold Edge at an average of £487,398 and Ladden Brook at an average of £477,088.
What locations have the most affordable properties for sale in Wotton-under-edge?
The location with the most affordable properties for sale in Wotton-under-edge is Charfield at an average of £401,200.
Which train stations are available in or near Wotton-under-edge?
Some of the train stations available in or near Wotton-under-edge are Yate, Cam and Dursley and Lydney.
Property Price Paid in Wotton-under-edge by Year
The average sold property price by year was:
| Year | Average Sold Price | Price Change |
Sold Properties
|
|---|---|---|---|
| 2024 | £380,000 | -7% |
2 Properties |
| 2023 | £407,984 | -12% |
50 Properties |
| 2022 | £455,423 | 6% |
66 Properties |
| 2021 | £428,691 | 11% |
124 Properties |
| 2020 | £382,398 | -3% |
119 Properties |
| 2019 | £393,890 | 4% |
145 Properties |
| 2018 | £377,693 | 10% |
106 Properties |
| 2017 | £339,788 | -7% |
122 Properties |
| 2016 | £363,587 | 13% |
90 Properties |
| 2015 | £317,577 | 12% |
92 Properties |
| 2014 | £277,998 | 1% |
96 Properties |
| 2013 | £274,885 | 6% |
86 Properties |
| 2012 | £257,310 | 1% |
63 Properties |
| 2011 | £255,021 | -8% |
66 Properties |
| 2010 | £276,144 | 8% |
75 Properties |
| 2009 | £254,948 | 1% |
68 Properties |
| 2008 | £252,574 | -14% |
58 Properties |
| 2007 | £287,545 | -2% |
112 Properties |
| 2006 | £292,690 | 11% |
105 Properties |
| 2005 | £261,623 | -0,2% |
94 Properties |
| 2004 | £262,042 | 19% |
102 Properties |
| 2003 | £212,595 | 7% |
113 Properties |
| 2002 | £197,601 | 22% |
124 Properties |
| 2001 | £154,554 | 4% |
118 Properties |
| 2000 | £149,048 | 25% |
97 Properties |
| 1999 | £112,252 | 9% |
131 Properties |
| 1998 | £101,913 | - |
117 Properties |
| 1997 | £101,887 | 12% |
142 Properties |
| 1996 | £90,110 | -0,4% |
111 Properties |
| 1995 | £90,430 | - |
130 Properties |
Property Price per Property Type in Wotton-under-edge
Here you can find historic sold price data in order to help with your property search.
The average Property Paid Price for specific property types in the last three years are:
| Property Type | Average Sold Price | Sold Properties |
|---|---|---|
| Flat | £174,100.00 | 5 Flats |
| Semi Detached House | £351,409.00 | 69 Semi Detached Houses |
| Detached House | £518,219.00 | 131 Detached Houses |
| Terraced House | £307,308.00 | 37 Terraced Houses |