
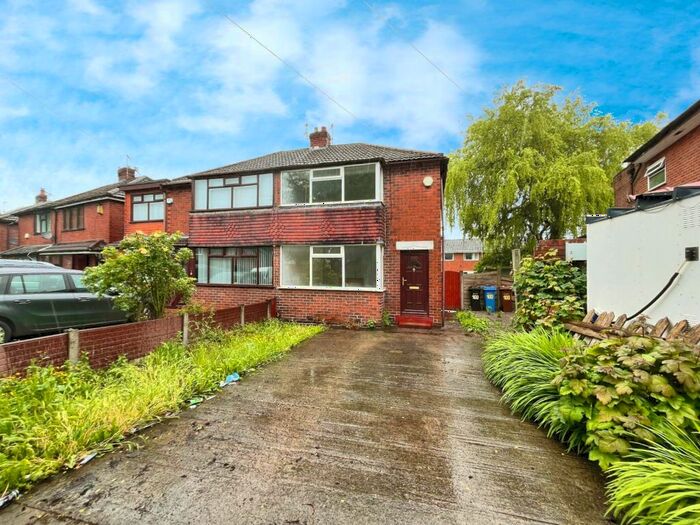
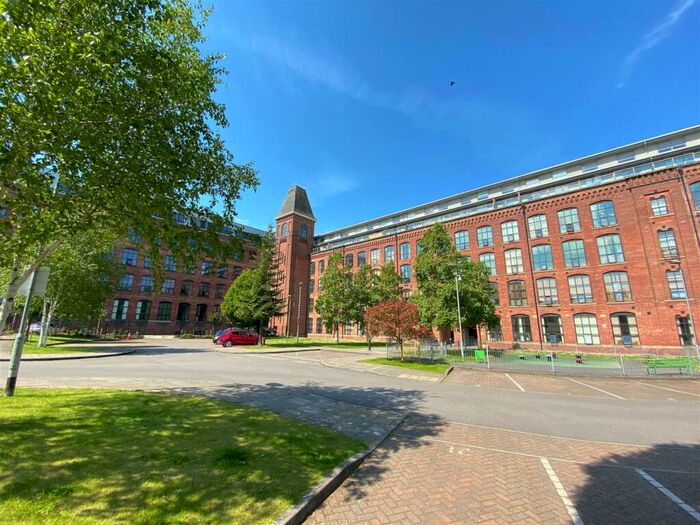
Houses for sale & to rent in Manchester, Stockport
House Prices in Manchester
Properties in Manchester have an average house price of £224,873.00 and had 35 Property Transactions within the last 3 years.¹
Manchester is an area in Stockport with 336 households², where the most expensive property was sold for £520,000.00.
Properties for sale in Manchester


Neighbourhoods in Manchester
Navigate through our locations to find the location of your next house in Manchester, Stockport for sale or to rent.
Transport in Manchester
Please see below transportation links in this area:
-
 Heaton Chapel Station
 -
Levenshulme Station
-
Mauldeth Road Station
-
Reddish South Station
-
Burnage Station
-
Reddish North Station
-
Ryder Brow Station
-
Belle Vue Station
-
Brinnington Station
-
Stockport Station
- FAQ
- Price Paid By Year
- Property Type Price
Frequently asked questions about Manchester
What is the average price for a property for sale in Manchester?
The average price for a property for sale in Manchester is £224,873. This amount is 33% lower than the average price in Stockport. There are 3,255 property listings for sale in Manchester.
What locations have the most expensive properties for sale in Manchester?
The locations with the most expensive properties for sale in Manchester are Heatons South at an average of £287,075 and Heatons North at an average of £223,750.
What locations have the most affordable properties for sale in Manchester?
The location with the most affordable properties for sale in Manchester is Reddish North at an average of £195,468.
Which train stations are available in or near Manchester?
Some of the train stations available in or near Manchester are Heaton Chapel, Levenshulme and Mauldeth Road.
Property Price Paid in Manchester by Year
The average sold property price by year was:
| Year | Average Sold Price | Price Change |
Sold Properties
|
|---|---|---|---|
| 2024 | £200,000 | -22% |
1 Property |
| 2023 | £243,812 | -11% |
12 Properties |
| 2022 | £271,582 | 32% |
8 Properties |
| 2021 | £183,726 | -11% |
14 Properties |
| 2020 | £204,450 | -6% |
10 Properties |
| 2019 | £216,852 | 9% |
19 Properties |
| 2018 | £197,500 | 24% |
17 Properties |
| 2017 | £150,937 | 2% |
16 Properties |
| 2016 | £148,495 | -2% |
12 Properties |
| 2015 | £151,970 | -2% |
18 Properties |
| 2014 | £154,255 | 19% |
18 Properties |
| 2013 | £125,567 | -37% |
14 Properties |
| 2012 | £171,500 | 11% |
1 Property |
| 2011 | £152,166 | 9% |
6 Properties |
| 2010 | £138,620 | 10% |
6 Properties |
| 2009 | £124,312 | -5% |
8 Properties |
| 2008 | £129,950 | -12% |
10 Properties |
| 2007 | £146,033 | 7% |
18 Properties |
| 2006 | £135,712 | 12% |
19 Properties |
| 2005 | £119,160 | 6% |
17 Properties |
| 2004 | £112,550 | -9% |
25 Properties |
| 2003 | £122,564 | 34% |
53 Properties |
| 2002 | £80,963 | 18% |
24 Properties |
| 2001 | £66,000 | 11% |
25 Properties |
| 2000 | £58,616 | 5% |
31 Properties |
| 1999 | £55,912 | 7% |
32 Properties |
| 1998 | £51,810 | -11% |
13 Properties |
| 1997 | £57,450 | 9% |
21 Properties |
| 1996 | £52,162 | -0,2% |
43 Properties |
| 1995 | £52,256 | - |
34 Properties |
Property Price per Property Type in Manchester
Here you can find historic sold price data in order to help with your property search.
The average Property Paid Price for specific property types in the last three years are:
| Property Type | Average Sold Price | Sold Properties |
|---|---|---|
| Semi Detached House | £237,078.00 | 17 Semi Detached Houses |
| Flat | £182,093.00 | 8 Flats |
| Terraced House | £225,944.00 | 9 Terraced Houses |
| Detached House | £350,000.00 | 1 Detached House |