
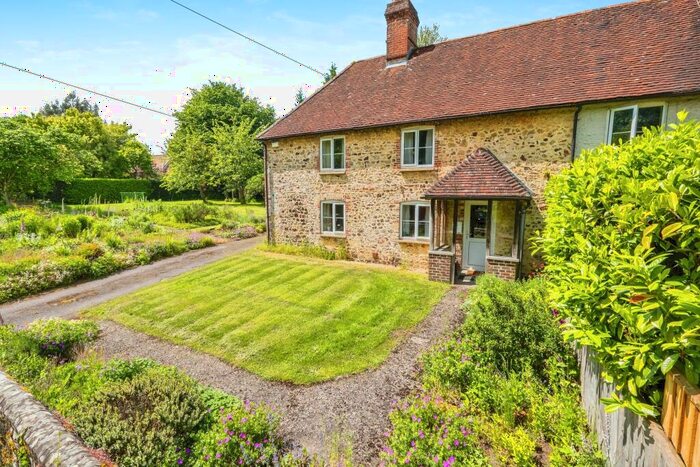
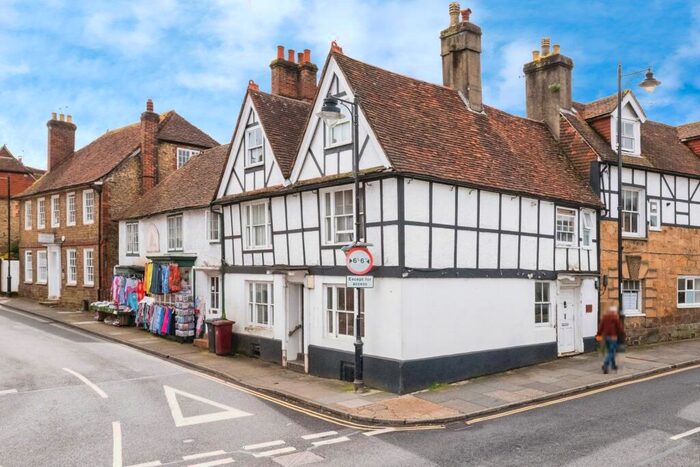
Houses for sale & to rent in Midhurst, Surrey
House Prices in Midhurst
Properties in Midhurst have an average house price of £539,889.00 and had 558 Property Transactions within the last 3 years.¹
Midhurst is an area in Surrey with 4,277 households², where the most expensive property was sold for £5,490,400.00.
Properties for sale in Midhurst


Neighbourhoods in Midhurst
Navigate through our locations to find the location of your next house in Midhurst, Surrey for sale or to rent.
Transport in Midhurst
Please see below transportation links in this area:

- FAQ
- Price Paid By Year
- Property Type Price
Frequently asked questions about Midhurst
What is the average price for a property for sale in Midhurst?
The average price for a property for sale in Midhurst is £539,889. This amount is 13% lower than the average price in Surrey. There are 1,669 property listings for sale in Midhurst.
What locations have the most expensive properties for sale in Midhurst?
The locations with the most expensive properties for sale in Midhurst are Harting at an average of £1,141,606, Bury at an average of £1,014,250 and Stedham at an average of £922,516.
What locations have the most affordable properties for sale in Midhurst?
The locations with the most affordable properties for sale in Midhurst are Midhurst at an average of £387,106 and Easebourne at an average of £643,461.
Which train stations are available in or near Midhurst?
Some of the train stations available in or near Midhurst are Liphook, Haslemere and Liss.
Property Price Paid in Midhurst by Year
The average sold property price by year was:
| Year | Average Sold Price | Price Change |
Sold Properties
|
|---|---|---|---|
| 2024 | £364,250 | -55% |
4 Properties |
| 2023 | £565,923 | -7% |
133 Properties |
| 2022 | £604,344 | 20% |
178 Properties |
| 2021 | £481,318 | -2% |
243 Properties |
| 2020 | £492,701 | 4% |
204 Properties |
| 2019 | £471,216 | -7% |
187 Properties |
| 2018 | £503,997 | 6% |
174 Properties |
| 2017 | £475,700 | 3% |
251 Properties |
| 2016 | £460,223 | 7% |
231 Properties |
| 2015 | £429,326 | 6% |
233 Properties |
| 2014 | £405,550 | 17% |
220 Properties |
| 2013 | £336,783 | -9% |
180 Properties |
| 2012 | £368,624 | -1% |
127 Properties |
| 2011 | £373,642 | 6% |
139 Properties |
| 2010 | £352,998 | 8% |
142 Properties |
| 2009 | £324,404 | -24% |
148 Properties |
| 2008 | £403,687 | 15% |
111 Properties |
| 2007 | £343,714 | 6% |
202 Properties |
| 2006 | £321,925 | 11% |
201 Properties |
| 2005 | £287,692 | 2% |
184 Properties |
| 2004 | £282,466 | 1% |
164 Properties |
| 2003 | £280,969 | 7% |
199 Properties |
| 2002 | £260,529 | 24% |
221 Properties |
| 2001 | £198,575 | 5% |
191 Properties |
| 2000 | £189,426 | 23% |
201 Properties |
| 1999 | £146,582 | -7% |
208 Properties |
| 1998 | £156,665 | 32% |
175 Properties |
| 1997 | £107,058 | -9% |
206 Properties |
| 1996 | £117,089 | 17% |
180 Properties |
| 1995 | £96,698 | - |
157 Properties |
Property Price per Property Type in Midhurst
Here you can find historic sold price data in order to help with your property search.
The average Property Paid Price for specific property types in the last three years are:
| Property Type | Average Sold Price | Sold Properties |
|---|---|---|
| Semi Detached House | £475,797.00 | 86 Semi Detached Houses |
| Terraced House | £397,705.00 | 138 Terraced Houses |
| Detached House | £930,113.00 | 162 Detached Houses |
| Flat | £318,477.00 | 172 Flats |