
Houses for sale & to rent in Burgess Hill, West Sussex
House Prices in Burgess Hill
Properties in Burgess Hill have an average house price of £404,849.00 and had 1,696 Property Transactions within the last 3 years.¹
Burgess Hill is an area in West Sussex with 12,144 households², where the most expensive property was sold for £2,900,000.00.
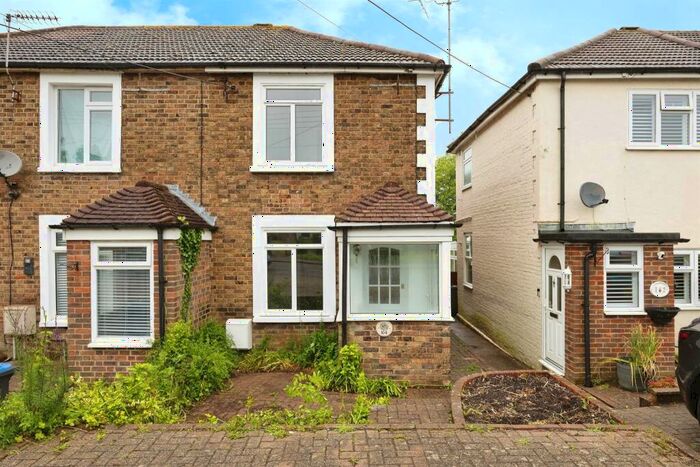
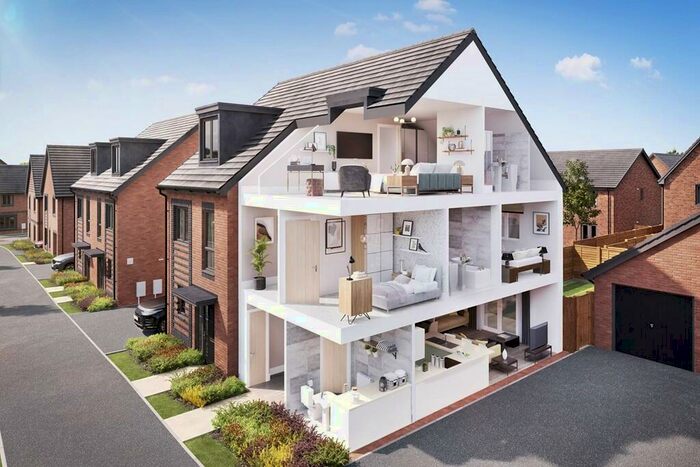
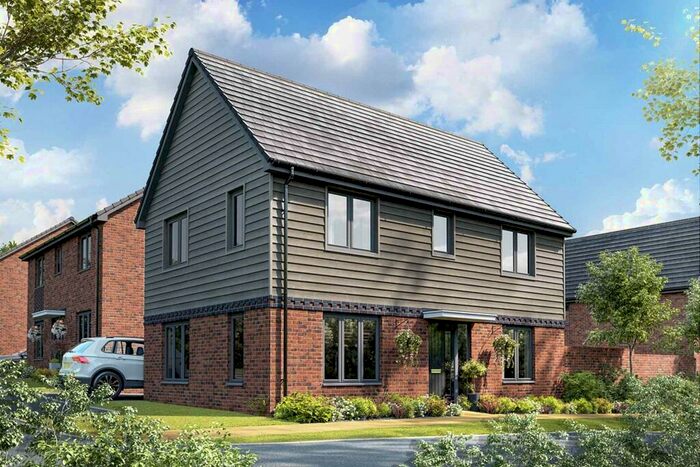
Properties for sale in Burgess Hill


Neighbourhoods in Burgess Hill
Navigate through our locations to find the location of your next house in Burgess Hill, West Sussex for sale or to rent.
Transport in Burgess Hill
Please see below transportation links in this area:

- FAQ
- Price Paid By Year
- Property Type Price
Frequently asked questions about Burgess Hill
What is the average price for a property for sale in Burgess Hill?
The average price for a property for sale in Burgess Hill is £404,849. This amount is 3% lower than the average price in West Sussex. There are 2,901 property listings for sale in Burgess Hill.
What locations have the most expensive properties for sale in Burgess Hill?
The locations with the most expensive properties for sale in Burgess Hill are Cuckfield at an average of £1,477,500, Hassocks at an average of £1,408,333 and Burgess Hill Franklands at an average of £535,786.
What locations have the most affordable properties for sale in Burgess Hill?
The locations with the most affordable properties for sale in Burgess Hill are Burgess Hill Meeds at an average of £309,427, Burgess Hill Victoria at an average of £364,564 and Burgess Hill Dunstall at an average of £391,120.
Which train stations are available in or near Burgess Hill?
Some of the train stations available in or near Burgess Hill are Burgess Hill, Wivelsfield and Hassocks.
Property Price Paid in Burgess Hill by Year
The average sold property price by year was:
| Year | Average Sold Price | Price Change |
Sold Properties
|
|---|---|---|---|
| 2024 | £456,250 | 13% |
24 Properties |
| 2023 | £396,200 | -4% |
404 Properties |
| 2022 | £412,117 | 2% |
537 Properties |
| 2021 | £402,602 | 7% |
731 Properties |
| 2020 | £375,278 | 3% |
559 Properties |
| 2019 | £362,712 | 2% |
697 Properties |
| 2018 | £356,833 | 4% |
606 Properties |
| 2017 | £344,188 | 2% |
595 Properties |
| 2016 | £338,606 | 11% |
547 Properties |
| 2015 | £299,824 | 3% |
617 Properties |
| 2014 | £291,135 | 11% |
661 Properties |
| 2013 | £258,771 | 0,3% |
611 Properties |
| 2012 | £257,978 | 8% |
513 Properties |
| 2011 | £236,531 | -4% |
426 Properties |
| 2010 | £244,844 | 8% |
460 Properties |
| 2009 | £224,222 | -13% |
448 Properties |
| 2008 | £252,452 | 4% |
354 Properties |
| 2007 | £243,013 | 7% |
728 Properties |
| 2006 | £227,108 | 7% |
781 Properties |
| 2005 | £212,304 | 2% |
611 Properties |
| 2004 | £207,475 | 6% |
755 Properties |
| 2003 | £194,212 | 17% |
777 Properties |
| 2002 | £160,360 | 9% |
827 Properties |
| 2001 | £145,483 | 9% |
829 Properties |
| 2000 | £132,552 | 22% |
729 Properties |
| 1999 | £103,399 | 6% |
788 Properties |
| 1998 | £97,428 | 10% |
926 Properties |
| 1997 | £87,648 | 10% |
1,085 Properties |
| 1996 | £78,951 | 4% |
939 Properties |
| 1995 | £75,513 | - |
739 Properties |
Property Price per Property Type in Burgess Hill
Here you can find historic sold price data in order to help with your property search.
The average Property Paid Price for specific property types in the last three years are:
| Property Type | Average Sold Price | Sold Properties |
|---|---|---|
| Semi Detached House | £405,126.00 | 510 Semi Detached Houses |
| Terraced House | £329,757.00 | 466 Terraced Houses |
| Detached House | £594,783.00 | 449 Detached Houses |
| Flat | £218,764.00 | 271 Flats |