
Houses for sale & to rent in Leigh, Wigan
House Prices in Leigh
Properties in Leigh have an average house price of £157,030.00 and had 2,709 Property Transactions within the last 3 years.¹
Leigh is an area in Wigan with 21,100 households², where the most expensive property was sold for £1,968,792.00.
Properties for sale in Leigh


Neighbourhoods in Leigh
Navigate through our locations to find the location of your next house in Leigh, Wigan for sale or to rent.
Transport in Leigh
Please see below transportation links in this area:

- FAQ
- Price Paid By Year
- Property Type Price
Frequently asked questions about Leigh
What is the average price for a property for sale in Leigh?
The average price for a property for sale in Leigh is £157,030. This amount is 12% lower than the average price in Wigan. There are 7,570 property listings for sale in Leigh.
What locations have the most expensive properties for sale in Leigh?
The locations with the most expensive properties for sale in Leigh are Hindley Green at an average of £197,945, Leigh South at an average of £189,054 and Lowton East at an average of £184,115.
What locations have the most affordable properties for sale in Leigh?
The locations with the most affordable properties for sale in Leigh are Leigh West at an average of £128,962, Atherleigh at an average of £151,477 and Leigh East at an average of £159,880.
Which train stations are available in or near Leigh?
Some of the train stations available in or near Leigh are Hag Fold, Atherton and Daisy Hill.
Property Price Paid in Leigh by Year
The average sold property price by year was:
| Year | Average Sold Price | Price Change |
Sold Properties
|
|---|---|---|---|
| 2024 | £149,895 | -5% |
45 Properties |
| 2023 | £157,199 | -4% |
658 Properties |
| 2022 | £163,139 | 7% |
900 Properties |
| 2021 | £152,248 | 0,3% |
1,106 Properties |
| 2020 | £151,852 | 13% |
837 Properties |
| 2019 | £132,222 | 6% |
1,035 Properties |
| 2018 | £124,038 | 1% |
906 Properties |
| 2017 | £122,730 | 2% |
925 Properties |
| 2016 | £119,912 | 5% |
830 Properties |
| 2015 | £113,524 | 8% |
792 Properties |
| 2014 | £104,486 | 6% |
666 Properties |
| 2013 | £97,827 | -9% |
464 Properties |
| 2012 | £106,585 | 13% |
390 Properties |
| 2011 | £92,299 | -12% |
504 Properties |
| 2010 | £103,764 | -2% |
491 Properties |
| 2009 | £106,013 | -4% |
425 Properties |
| 2008 | £109,975 | -0,3% |
651 Properties |
| 2007 | £110,313 | -4% |
1,248 Properties |
| 2006 | £114,584 | 11% |
1,273 Properties |
| 2005 | £101,534 | 14% |
959 Properties |
| 2004 | £87,775 | 25% |
1,205 Properties |
| 2003 | £65,808 | 23% |
1,151 Properties |
| 2002 | £50,577 | 7% |
1,190 Properties |
| 2001 | £47,091 | 5% |
891 Properties |
| 2000 | £44,686 | 2% |
803 Properties |
| 1999 | £43,688 | -7% |
818 Properties |
| 1998 | £46,596 | 2% |
815 Properties |
| 1997 | £45,462 | 9% |
867 Properties |
| 1996 | £41,596 | 0,1% |
787 Properties |
| 1995 | £41,550 | - |
586 Properties |
Property Price per Property Type in Leigh
Here you can find historic sold price data in order to help with your property search.
The average Property Paid Price for specific property types in the last three years are:
| Property Type | Average Sold Price | Sold Properties |
|---|---|---|
| Terraced House | £117,863.00 | 1,311 Terraced Houses |
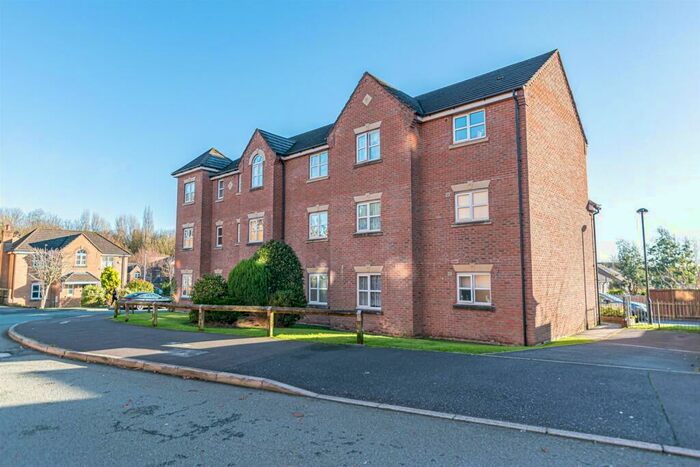
| Flat | £95,712.00 | 216 Flats |
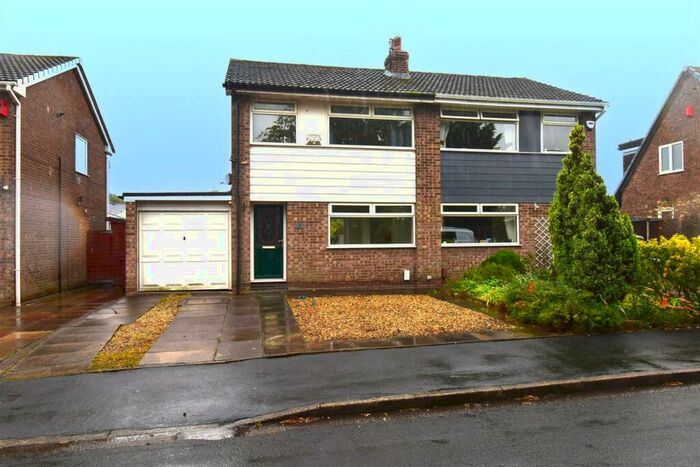
| Semi Detached House | £181,959.00 | 868 Semi Detached Houses |
| Detached House | £293,829.00 | 314 Detached Houses |