
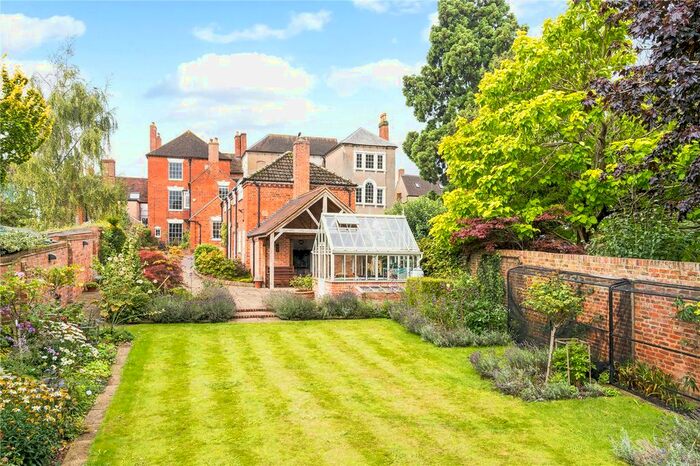
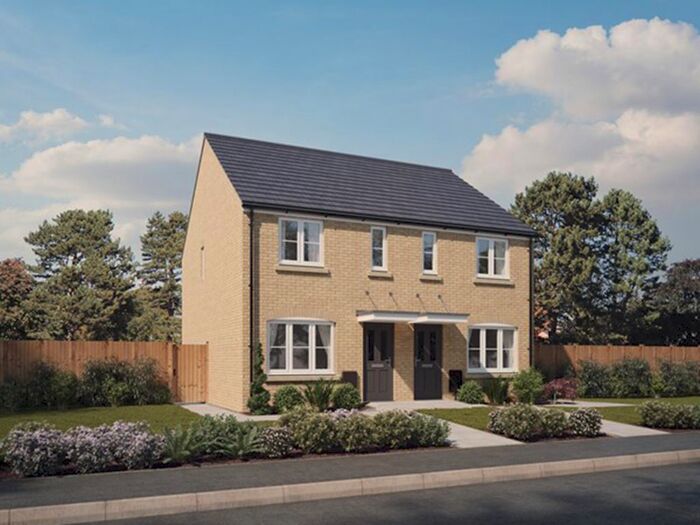
Houses for sale & to rent in Pershore, Worcestershire
House Prices in Pershore
Properties in Pershore have an average house price of £374,201.00 and had 866 Property Transactions within the last 3 years.¹
Pershore is an area in Worcestershire with 7,722 households², where the most expensive property was sold for £3,000,000.00.
Properties for sale in Pershore


Neighbourhoods in Pershore
Navigate through our locations to find the location of your next house in Pershore, Worcestershire for sale or to rent.
Transport in Pershore
Please see below transportation links in this area:
-
 Pershore Station
 -
Evesham Station
-
Worcester Shrub Hill Station
-
Ashchurch Station
-
Worcester Foregate Street Station
-
Honeybourne Station
- FAQ
- Price Paid By Year
- Property Type Price
Frequently asked questions about Pershore
What is the average price for a property for sale in Pershore?
The average price for a property for sale in Pershore is £374,201. This amount is 17% higher than the average price in Worcestershire. There are 1,413 property listings for sale in Pershore.
What locations have the most expensive properties for sale in Pershore?
The locations with the most expensive properties for sale in Pershore are Inkberrow at an average of £630,000, Eckington at an average of £477,872 and Elmley Castle And Somerville at an average of £473,431.
What locations have the most affordable properties for sale in Pershore?
The locations with the most affordable properties for sale in Pershore are Pershore at an average of £308,578, Drakes Broughton at an average of £368,414 and Pinvin at an average of £405,975.
Which train stations are available in or near Pershore?
Some of the train stations available in or near Pershore are Pershore, Evesham and Worcester Shrub Hill.
Property Price Paid in Pershore by Year
The average sold property price by year was:
| Year | Average Sold Price | Price Change |
Sold Properties
|
|---|---|---|---|
| 2024 | £331,277 | -11% |
9 Properties |
| 2023 | £368,418 | -4% |
200 Properties |
| 2022 | £383,104 | 3% |
277 Properties |
| 2021 | £371,771 | 9% |
380 Properties |
| 2020 | £336,660 | 11% |
276 Properties |
| 2019 | £298,964 | -2% |
378 Properties |
| 2018 | £305,909 | 0,3% |
399 Properties |
| 2017 | £305,076 | 5% |
390 Properties |
| 2016 | £290,822 | 5% |
381 Properties |
| 2015 | £277,309 | 4% |
313 Properties |
| 2014 | £267,481 | 11% |
289 Properties |
| 2013 | £237,923 | -3% |
274 Properties |
| 2012 | £245,655 | 1% |
250 Properties |
| 2011 | £243,585 | -1% |
234 Properties |
| 2010 | £245,629 | 14% |
212 Properties |
| 2009 | £211,140 | -27% |
188 Properties |
| 2008 | £268,384 | 2% |
169 Properties |
| 2007 | £264,313 | 10% |
264 Properties |
| 2006 | £238,610 | 5% |
345 Properties |
| 2005 | £227,773 | 4% |
290 Properties |
| 2004 | £219,559 | 7% |
288 Properties |
| 2003 | £203,905 | 20% |
340 Properties |
| 2002 | £163,257 | 6% |
360 Properties |
| 2001 | £153,455 | 12% |
394 Properties |
| 2000 | £134,686 | 14% |
345 Properties |
| 1999 | £116,038 | 14% |
362 Properties |
| 1998 | £99,422 | -3% |
319 Properties |
| 1997 | £102,657 | 12% |
366 Properties |
| 1996 | £90,200 | 2% |
358 Properties |
| 1995 | £88,368 | - |
269 Properties |
Property Price per Property Type in Pershore
Here you can find historic sold price data in order to help with your property search.
The average Property Paid Price for specific property types in the last three years are:
| Property Type | Average Sold Price | Sold Properties |
|---|---|---|
| Semi Detached House | £297,911.00 | 231 Semi Detached Houses |
| Terraced House | £261,525.00 | 180 Terraced Houses |
| Detached House | £492,882.00 | 407 Detached Houses |
| Flat | £157,559.00 | 48 Flats |