
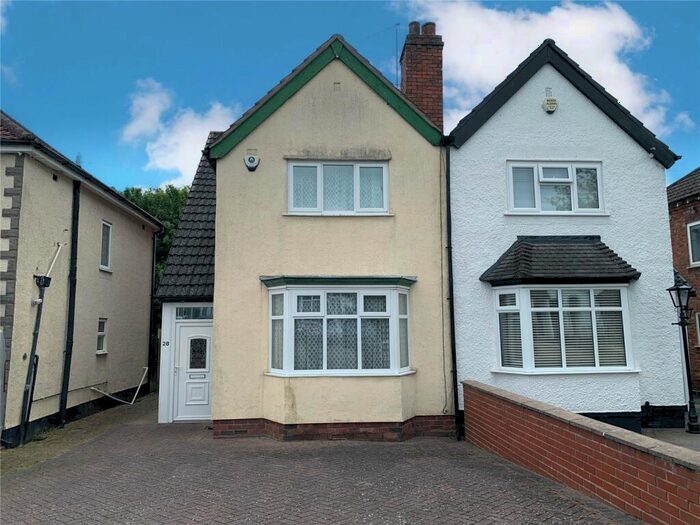
Houses for sale & to rent in Stourbridge, Worcestershire
House Prices in Stourbridge
Properties in Stourbridge have an average house price of £480,012.00 and had 474 Property Transactions within the last 3 years.¹
Stourbridge is an area in Worcestershire with 3,843 households², where the most expensive property was sold for £3,000,000.00.
Properties for sale in Stourbridge


Neighbourhoods in Stourbridge
Navigate through our locations to find the location of your next house in Stourbridge, Worcestershire for sale or to rent.
Transport in Stourbridge
Please see below transportation links in this area:

- FAQ
- Price Paid By Year
- Property Type Price
Frequently asked questions about Stourbridge
What is the average price for a property for sale in Stourbridge?
The average price for a property for sale in Stourbridge is £480,012. This amount is 42% higher than the average price in Worcestershire. There are more than 10,000 property listings for sale in Stourbridge.
What locations have the most expensive properties for sale in Stourbridge?
The locations with the most expensive properties for sale in Stourbridge are Wyre Forest Rural at an average of £1,049,583, Blakedown And Chaddesley at an average of £918,318 and Belbroughton & Romsley at an average of £684,375.
What locations have the most affordable properties for sale in Stourbridge?
The locations with the most affordable properties for sale in Stourbridge are Uffdown at an average of £275,000, Hagley at an average of £404,368 and Hagley East at an average of £440,167.
Which train stations are available in or near Stourbridge?
Some of the train stations available in or near Stourbridge are Hagley, Blakedown and Stourbridge Junction.
Property Price Paid in Stourbridge by Year
The average sold property price by year was:
| Year | Average Sold Price | Price Change |
Sold Properties
|
|---|---|---|---|
| 2024 | £477,487 | -15% |
4 Properties |
| 2023 | £548,216 | 17% |
94 Properties |
| 2022 | £456,509 | -3% |
166 Properties |
| 2021 | £468,110 | 1% |
210 Properties |
| 2020 | £463,360 | 15% |
160 Properties |
| 2019 | £394,201 | 1% |
194 Properties |
| 2018 | £391,950 | 8% |
273 Properties |
| 2017 | £361,781 | 2% |
272 Properties |
| 2016 | £354,242 | - |
340 Properties |
| 2015 | £354,375 | 2% |
218 Properties |
| 2014 | £345,848 | 12% |
198 Properties |
| 2013 | £303,754 | -11% |
126 Properties |
| 2012 | £336,580 | 2% |
111 Properties |
| 2011 | £328,998 | -5% |
118 Properties |
| 2010 | £345,999 | 16% |
145 Properties |
| 2009 | £290,976 | -20% |
116 Properties |
| 2008 | £349,763 | 4% |
104 Properties |
| 2007 | £334,467 | 4% |
195 Properties |
| 2006 | £320,154 | 16% |
210 Properties |
| 2005 | £267,441 | -16% |
257 Properties |
| 2004 | £310,259 | 23% |
191 Properties |
| 2003 | £238,935 | 16% |
189 Properties |
| 2002 | £200,591 | 5% |
261 Properties |
| 2001 | £190,768 | 9% |
207 Properties |
| 2000 | £173,982 | 10% |
176 Properties |
| 1999 | £155,990 | 18% |
195 Properties |
| 1998 | £127,827 | 14% |
160 Properties |
| 1997 | £110,557 | -3% |
216 Properties |
| 1996 | £113,338 | 16% |
164 Properties |
| 1995 | £95,712 | - |
111 Properties |
Property Price per Property Type in Stourbridge
Here you can find historic sold price data in order to help with your property search.
The average Property Paid Price for specific property types in the last three years are:
| Property Type | Average Sold Price | Sold Properties |
|---|---|---|
| Semi Detached House | £399,552.00 | 115 Semi Detached Houses |
| Detached House | £670,566.00 | 210 Detached Houses |
| Flat | £209,136.00 | 73 Flats |
| Terraced House | £335,416.00 | 76 Terraced Houses |