
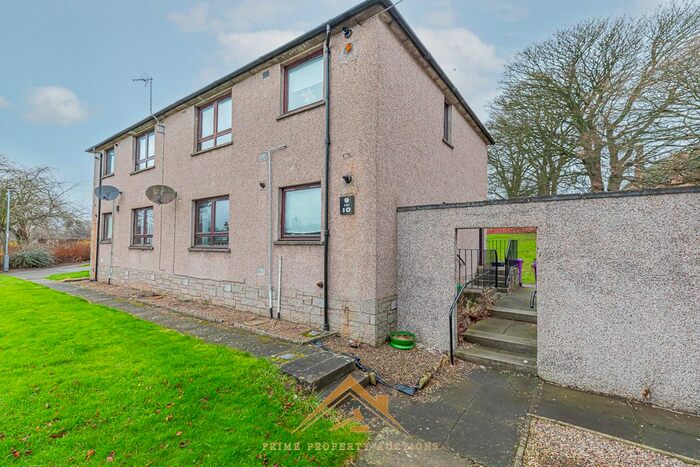
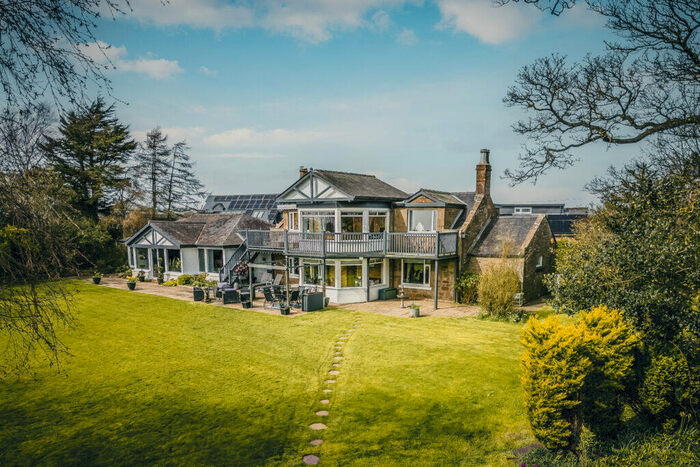
Houses for sale & to rent in Arbroath, Angus
House Prices in Arbroath
Properties in Arbroath have an average house price of £162,828.00 and had 1,181 Property Transactions within the last 3 years.¹
Arbroath is an area in Angus with 13,002 households², where the most expensive property was sold for £750,000.00.
Properties for sale in Arbroath


Neighbourhoods in Arbroath
Navigate through our locations to find the location of your next house in Arbroath, Angus for sale or to rent.
Transport in Arbroath
Please see below transportation links in this area:

- FAQ
- Price Paid By Year
Frequently asked questions about Arbroath
What is the average price for a property for sale in Arbroath?
The average price for a property for sale in Arbroath is £162,828. This amount is 13% lower than the average price in Angus. There are 800 property listings for sale in Arbroath.
What locations have the most expensive properties for sale in Arbroath?
The locations with the most expensive properties for sale in Arbroath are Montrose and District at an average of £400,000 and Arbroath West, Letham and Friockheim at an average of £183,272.
What locations have the most affordable properties for sale in Arbroath?
The location with the most affordable properties for sale in Arbroath is Arbroath East and Lunan at an average of £136,723.
Which train stations are available in or near Arbroath?
Some of the train stations available in or near Arbroath are Arbroath, Carnoustie and Golf Street.
Property Price Paid in Arbroath by Year
The average sold property price by year was:
| Year | Average Sold Price | Price Change |
Sold Properties
|
|---|---|---|---|
| 2023 | £147,155 | -16% |
84 Properties |
| 2022 | £171,279 | 8% |
491 Properties |
| 2021 | £158,153 | 5% |
606 Properties |
| 2020 | £150,203 | 6% |
417 Properties |
| 2019 | £141,847 | -3% |
528 Properties |
| 2018 | £146,197 | -0,1% |
531 Properties |
| 2017 | £146,338 | 3% |
461 Properties |
| 2016 | £141,555 | 5% |
434 Properties |
| 2015 | £134,081 | -1% |
453 Properties |
| 2014 | £135,792 | -0,3% |
436 Properties |
| 2013 | £136,190 | 12% |
384 Properties |
| 2012 | £120,455 | 5% |
308 Properties |
| 2011 | £114,935 | -2% |
308 Properties |
| 2010 | £117,531 | 4% |
347 Properties |
| 2009 | £113,322 | 4% |
322 Properties |
| 2008 | £109,085 | -18% |
389 Properties |
| 2007 | £128,607 | 12% |
553 Properties |
| 2006 | £112,782 | 24% |
604 Properties |
| 2005 | £85,970 | 9% |
677 Properties |
| 2004 | £78,361 | 7% |
583 Properties |
| 2003 | £72,688 | 28% |
717 Properties |
| 2002 | £52,242 | -17% |
728 Properties |
| 2001 | £60,918 | - |
50 Properties |