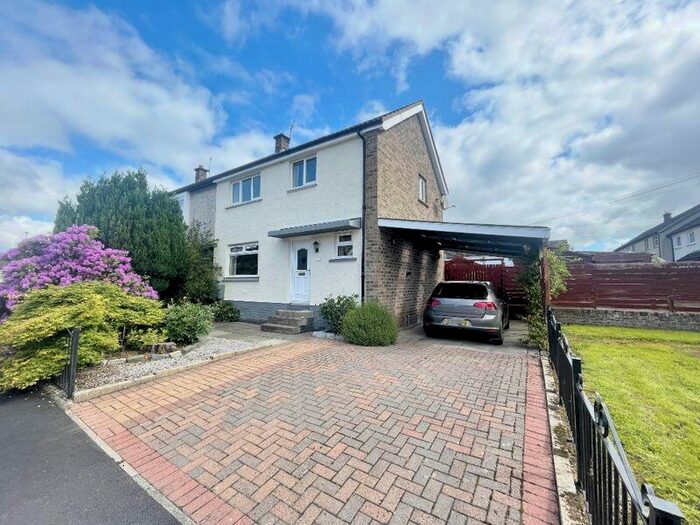
Houses for sale & to rent in Clackmannan, Clackmannanshire
House Prices in Clackmannan
Properties in Clackmannan have an average house price of £156,393.00 and had 1,322 Property Transactions within the last 3 years.¹
Clackmannan is an area in Clackmannanshire with 14,857 households², where the most expensive property was sold for £825,000.00.
Properties for sale in Clackmannan
Neighbourhoods in Clackmannan
Navigate through our locations to find the location of your next house in Clackmannan, Clackmannanshire for sale or to rent.
Transport in Clackmannan
Please see below transportation links in this area:
-
Alloa Station
-
Stirling Station
-
Bridge Of Allan Station
-
Larbert Station
-
Dunblane Station
-
Camelon Station
-
Falkirk Grahamston Station
-
Falkirk High Station
-
Polmont Station
- FAQ
- Price Paid By Year
Frequently asked questions about Clackmannan
What is the average price for a property for sale in Clackmannan?
The average price for a property for sale in Clackmannan is £156,393. This amount is 10% lower than the average price in Clackmannanshire. There are 2,821 property listings for sale in Clackmannan.
What locations have the most expensive properties for sale in Clackmannan?
The locations with the most expensive properties for sale in Clackmannan are Clackmannanshire East at an average of £186,298 and Clackmannanshire Central at an average of £157,162.
What locations have the most affordable properties for sale in Clackmannan?
The locations with the most affordable properties for sale in Clackmannan are Clackmannanshire South at an average of £145,085 and Clackmannanshire West at an average of £152,767.
Which train stations are available in or near Clackmannan?
Some of the train stations available in or near Clackmannan are Alloa, Stirling and Bridge Of Allan.
Property Price Paid in Clackmannan by Year
The average sold property price by year was:
| Year | Average Sold Price | Price Change |
Sold Properties
|
|---|---|---|---|
| 2023 | £143,758 | -15% |
115 Properties |
| 2022 | £165,339 | 10% |
614 Properties |
| 2021 | £149,581 | 5% |
593 Properties |
| 2020 | £142,388 | 6% |
490 Properties |
| 2019 | £134,305 | 1% |
549 Properties |
| 2018 | £133,568 | 8% |
585 Properties |
| 2017 | £123,036 | 2% |
605 Properties |
| 2016 | £120,478 | 0,3% |
636 Properties |
| 2015 | £120,140 | -4% |
534 Properties |
| 2014 | £124,724 | 7% |
550 Properties |
| 2013 | £115,954 | 9% |
493 Properties |
| 2012 | £105,982 | -2% |
359 Properties |
| 2011 | £108,451 | -5% |
319 Properties |
| 2010 | £114,363 | 2% |
354 Properties |
| 2009 | £112,344 | -3% |
370 Properties |
| 2008 | £115,744 | -3% |
542 Properties |
| 2007 | £118,697 | 9% |
856 Properties |
| 2006 | £108,306 | 19% |
947 Properties |
| 2005 | £87,633 | 6% |
1,021 Properties |
| 2004 | £81,987 | 28% |
921 Properties |
| 2003 | £58,800 | 10% |
990 Properties |
| 2002 | £52,726 | 5% |
865 Properties |
| 2001 | £50,078 | - |
61 Properties |


