
Houses for sale & to rent in Bonnybridge, Falkirk
House Prices in Bonnybridge
Properties in Bonnybridge have an average house price of £166,304.00 and had 381 Property Transactions within the last 3 years.¹
Bonnybridge is an area in Falkirk with 5,500 households², where the most expensive property was sold for £570,000.00.
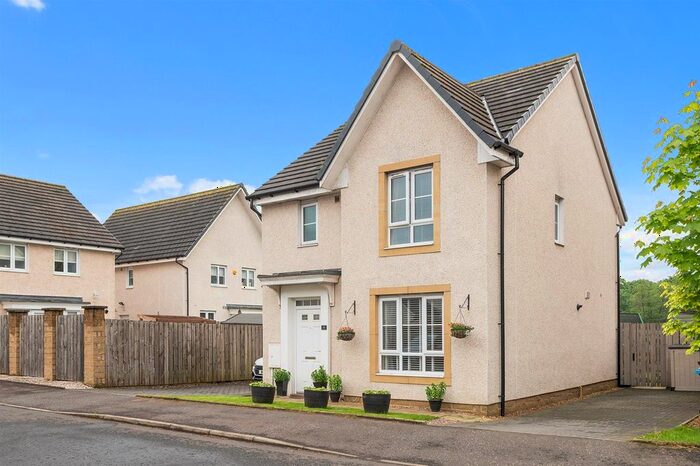
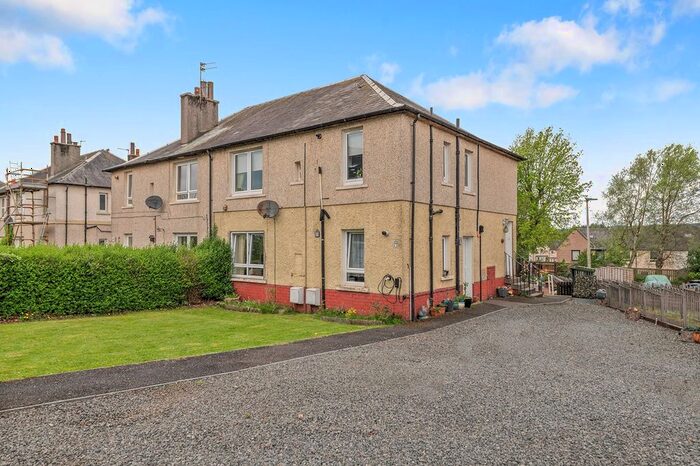
Properties for sale in Bonnybridge


Neighbourhoods in Bonnybridge
Navigate through our locations to find the location of your next house in Bonnybridge, Falkirk for sale or to rent.
Transport in Bonnybridge
Please see below transportation links in this area:

- FAQ
- Price Paid By Year
Frequently asked questions about Bonnybridge
What is the average price for a property for sale in Bonnybridge?
The average price for a property for sale in Bonnybridge is £166,304. This amount is 1% lower than the average price in Falkirk. There are 1,018 property listings for sale in Bonnybridge.
What locations have the most expensive properties for sale in Bonnybridge?
The location with the most expensive properties for sale in Bonnybridge is Denny and Banknock at an average of £168,971.
What locations have the most affordable properties for sale in Bonnybridge?
The location with the most affordable properties for sale in Bonnybridge is Bonnybridge and Larbert at an average of £164,475.
Which train stations are available in or near Bonnybridge?
Some of the train stations available in or near Bonnybridge are Larbert, Camelon and Falkirk High.
Property Price Paid in Bonnybridge by Year
The average sold property price by year was:
| Year | Average Sold Price | Price Change |
Sold Properties
|
|---|---|---|---|
| 2023 | £154,193 | -13% |
29 Properties |
| 2022 | £173,803 | 7% |
159 Properties |
| 2021 | £161,946 | 5% |
193 Properties |
| 2020 | £153,831 | 8% |
169 Properties |
| 2019 | £141,570 | -8% |
205 Properties |
| 2018 | £152,396 | 11% |
221 Properties |
| 2017 | £136,315 | 11% |
236 Properties |
| 2016 | £121,098 | 3% |
207 Properties |
| 2015 | £117,409 | 2% |
196 Properties |
| 2014 | £114,651 | 3% |
200 Properties |
| 2013 | £111,752 | -4% |
182 Properties |
| 2012 | £115,769 | -7% |
142 Properties |
| 2011 | £123,730 | 6% |
150 Properties |
| 2010 | £116,001 | 3% |
135 Properties |
| 2009 | £112,994 | -9% |
124 Properties |
| 2008 | £123,311 | -17% |
219 Properties |
| 2007 | £144,769 | 23% |
312 Properties |
| 2006 | £111,477 | 22% |
362 Properties |
| 2005 | £87,070 | -4% |
366 Properties |
| 2004 | £90,808 | 26% |
378 Properties |
| 2003 | £67,063 | 7% |
413 Properties |
| 2002 | £62,180 | -55% |
340 Properties |
| 2001 | £96,247 | - |
29 Properties |