
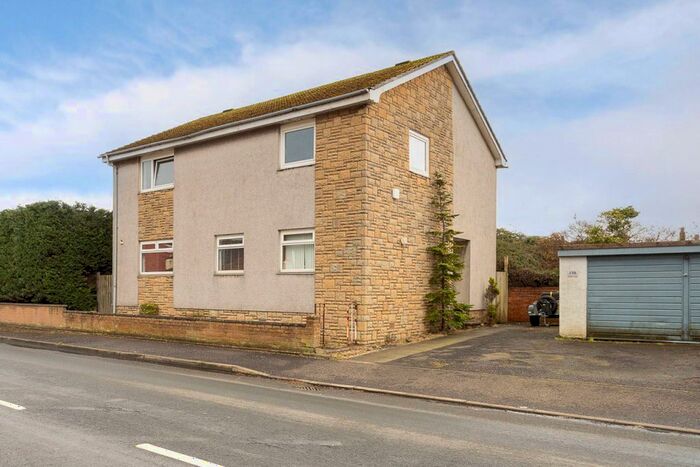
Houses for sale & to rent in Burntisland, Fife
House Prices in Burntisland
Properties in Burntisland have an average house price of £204,308.00 and had 521 Property Transactions within the last 3 years.¹
Burntisland is an area in Fife with 5,063 households², where the most expensive property was sold for £920,000.00.
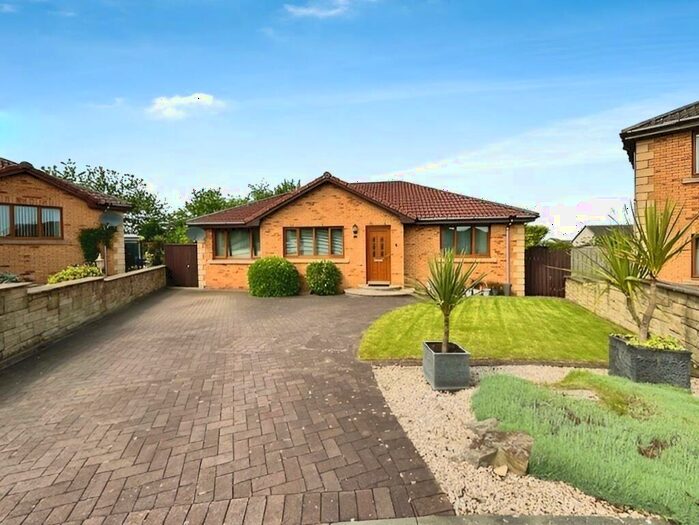
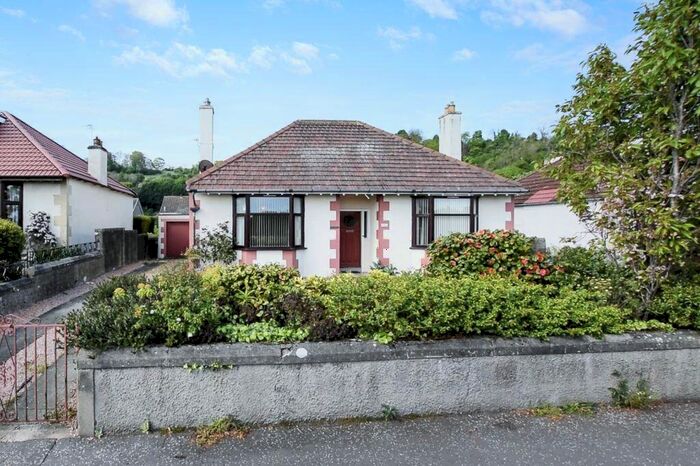
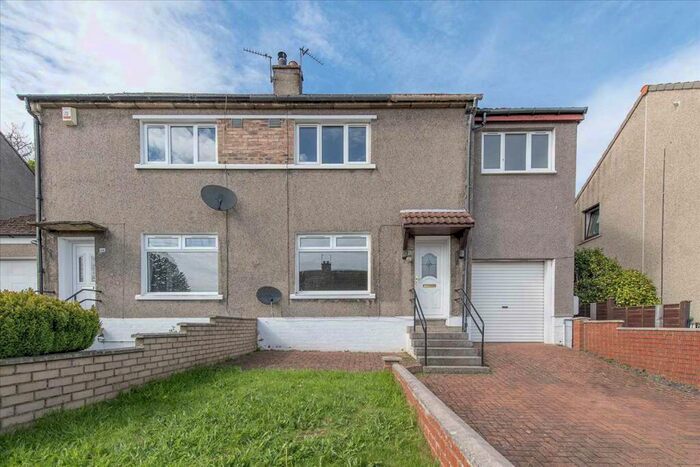
Properties for sale in Burntisland


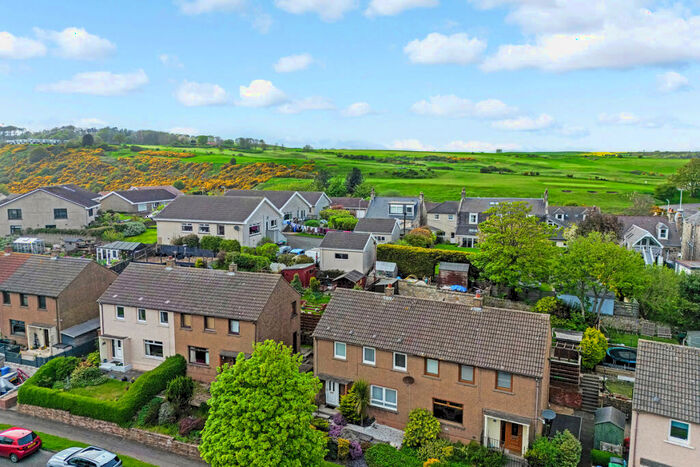


Neighbourhoods in Burntisland
Navigate through our locations to find the location of your next house in Burntisland, Fife for sale or to rent.
Transport in Burntisland
Please see below transportation links in this area:

- FAQ
- Price Paid By Year
Frequently asked questions about Burntisland
What is the average price for a property for sale in Burntisland?
The average price for a property for sale in Burntisland is £204,308. This amount is 8% higher than the average price in Fife. There are 832 property listings for sale in Burntisland.
What locations have the most expensive properties for sale in Burntisland?
The location with the most expensive properties for sale in Burntisland is Inverkeithing and Dalgety Bay at an average of £338,600.
What locations have the most affordable properties for sale in Burntisland?
The location with the most affordable properties for sale in Burntisland is Burntisland, Kinghorn and Western Kirkcaldy at an average of £180,305.
Which train stations are available in or near Burntisland?
Some of the train stations available in or near Burntisland are Burntisland, Kinghorn and Aberdour.
Property Price Paid in Burntisland by Year
The average sold property price by year was:
| Year | Average Sold Price | Price Change |
Sold Properties
|
|---|---|---|---|
| 2023 | £239,389 | 17% |
57 Properties |
| 2022 | £198,588 | -1% |
218 Properties |
| 2021 | £201,248 | 9% |
246 Properties |
| 2020 | £182,356 | 4% |
231 Properties |
| 2019 | £175,700 | 3% |
226 Properties |
| 2018 | £170,963 | -1% |
258 Properties |
| 2017 | £172,013 | 10% |
203 Properties |
| 2016 | £154,190 | -5% |
234 Properties |
| 2015 | £161,875 | 7% |
250 Properties |
| 2014 | £150,936 | 3% |
202 Properties |
| 2013 | £146,939 | -1% |
213 Properties |
| 2012 | £147,940 | 0,3% |
178 Properties |
| 2011 | £147,454 | -2% |
162 Properties |
| 2010 | £149,977 | 11% |
178 Properties |
| 2009 | £133,492 | -13% |
184 Properties |
| 2008 | £150,253 | -7% |
215 Properties |
| 2007 | £161,408 | 22% |
240 Properties |
| 2006 | £126,038 | 17% |
322 Properties |
| 2005 | £104,423 | 16% |
285 Properties |
| 2004 | £87,374 | 15% |
317 Properties |
| 2003 | £73,865 | 14% |
334 Properties |
| 2002 | £63,851 | 34% |
269 Properties |
| 2001 | £42,094 | - |
24 Properties |