
Houses for sale & to rent in Thurso, Highland
House Prices in Thurso
Properties in Thurso have an average house price of £137,846.00 and had 445 Property Transactions within the last 3 years.¹
Thurso is an area in Highland with 5,950 households², where the most expensive property was sold for £610,000.00.
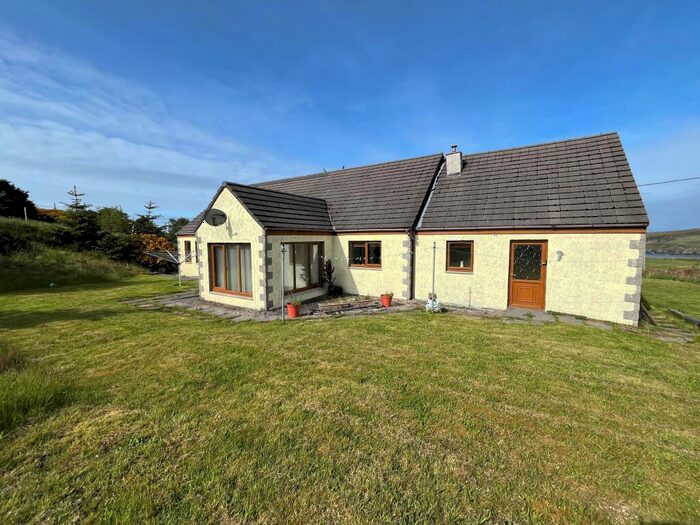
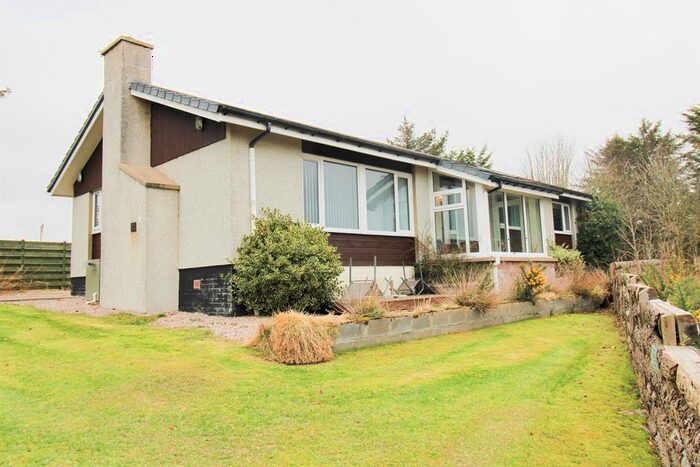
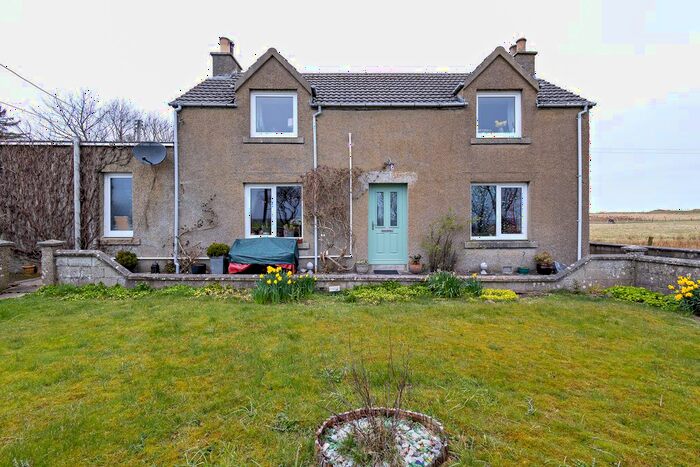
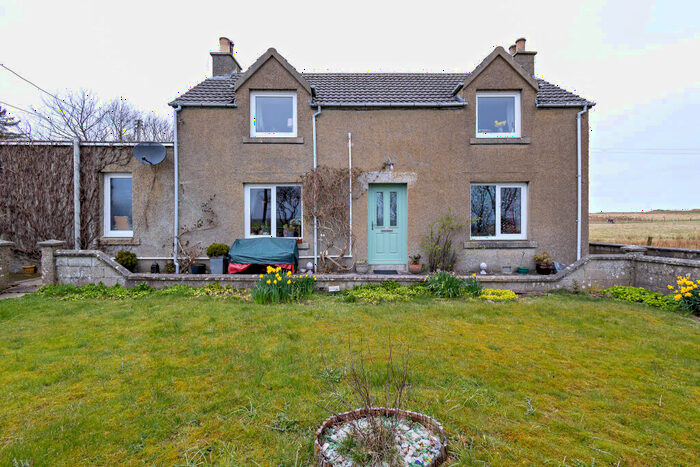
Properties for sale in Thurso


Neighbourhoods in Thurso
Navigate through our locations to find the location of your next house in Thurso, Highland for sale or to rent.
Transport in Thurso
Please see below transportation links in this area:

- FAQ
- Price Paid By Year
Frequently asked questions about Thurso
What is the average price for a property for sale in Thurso?
The average price for a property for sale in Thurso is £137,846. This amount is 44% lower than the average price in Highland. There are 994 property listings for sale in Thurso.
What locations have the most expensive properties for sale in Thurso?
The locations with the most expensive properties for sale in Thurso are Wick and East Caithness at an average of £177,029 and North, West and Central Sutherland at an average of £161,200.
What locations have the most affordable properties for sale in Thurso?
The location with the most affordable properties for sale in Thurso is Thurso and Northwest Caithness at an average of £133,721.
Which train stations are available in or near Thurso?
Some of the train stations available in or near Thurso are Thurso, Georgemas Junction and Scotscalder.
Property Price Paid in Thurso by Year
The average sold property price by year was:
| Year | Average Sold Price | Price Change |
Sold Properties
|
|---|---|---|---|
| 2023 | £134,717 | -10% |
39 Properties |
| 2022 | £147,874 | 13% |
198 Properties |
| 2021 | £128,886 | 14% |
208 Properties |
| 2020 | £110,466 | -0,4% |
168 Properties |
| 2019 | £110,906 | -0,2% |
185 Properties |
| 2018 | £111,156 | -3% |
234 Properties |
| 2017 | £114,413 | 7% |
193 Properties |
| 2016 | £106,874 | -1% |
200 Properties |
| 2015 | £108,422 | 2% |
170 Properties |
| 2014 | £106,025 | 1% |
202 Properties |
| 2013 | £105,228 | 3% |
159 Properties |
| 2012 | £102,007 | 2% |
146 Properties |
| 2011 | £99,617 | 10% |
135 Properties |
| 2010 | £89,776 | -6% |
131 Properties |
| 2009 | £95,401 | -20% |
145 Properties |
| 2008 | £114,019 | 21% |
209 Properties |
| 2007 | £89,650 | -20% |
242 Properties |
| 2006 | £107,462 | 31% |
246 Properties |
| 2005 | £74,182 | -10% |
198 Properties |
| 2004 | £81,421 | 25% |
260 Properties |
| 2003 | £61,101 | 2% |
156 Properties |
| 2002 | £60,111 | -1% |
54 Properties |
| 2001 | £60,532 | 10% |
54 Properties |
| 2000 | £54,773 | - |
18 Properties |