
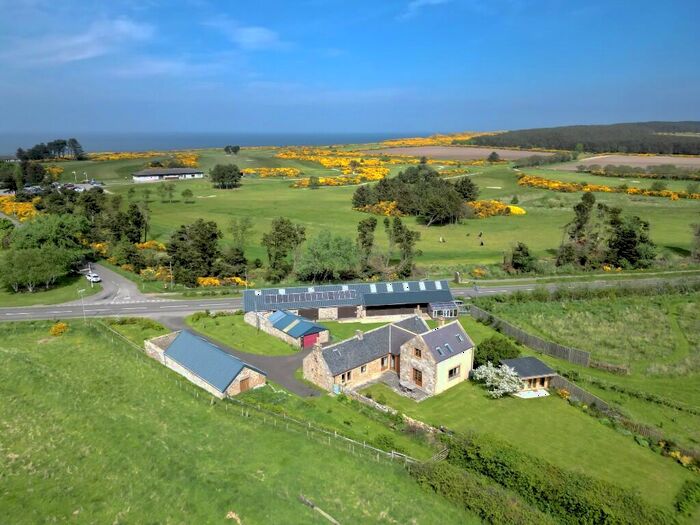
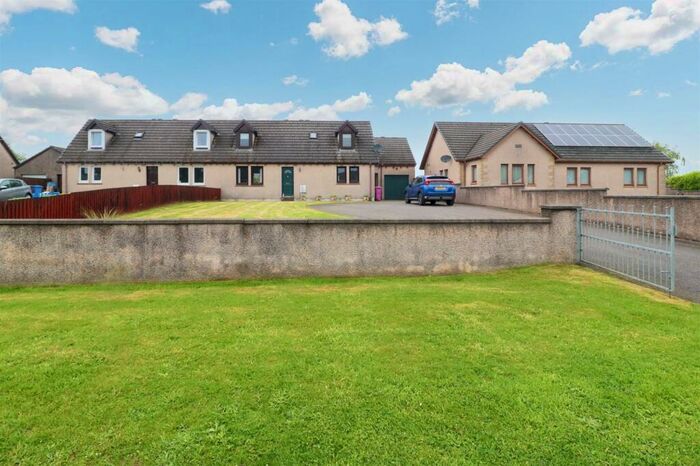
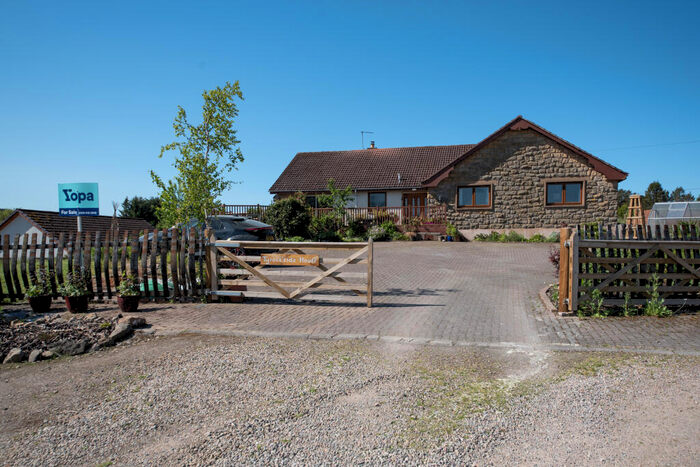
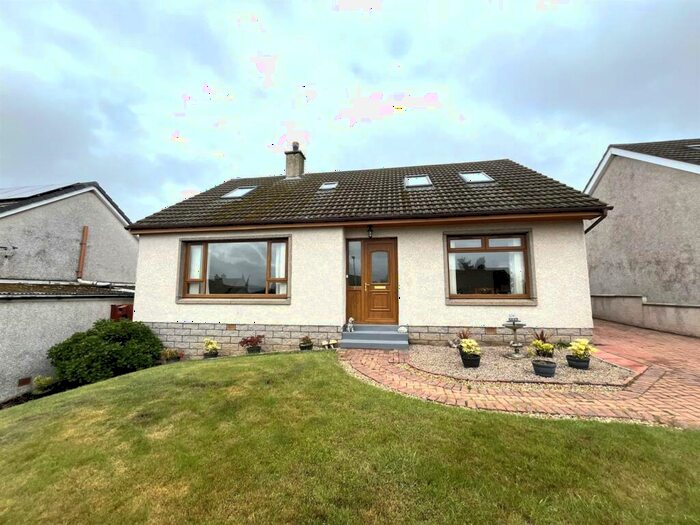
Houses for sale & to rent in Elgin, Moray
House Prices in Elgin
Properties in Elgin have an average house price of £198,340.00 and had 1,454 Property Transactions within the last 3 years.¹
Elgin is an area in Moray with 14,378 households², where the most expensive property was sold for £1,120,000.00.
Properties for sale in Elgin


Neighbourhoods in Elgin
Navigate through our locations to find the location of your next house in Elgin, Moray for sale or to rent.
Transport in Elgin
Please see below transportation links in this area:

- FAQ
- Price Paid By Year
Frequently asked questions about Elgin
What is the average price for a property for sale in Elgin?
The average price for a property for sale in Elgin is £198,340. This amount is 3% higher than the average price in Moray. There are 3,151 property listings for sale in Elgin.
What locations have the most expensive properties for sale in Elgin?
The locations with the most expensive properties for sale in Elgin are Speyside Glenlivet at an average of £363,714, Heldon and Laich at an average of £241,612 and Fochabers Lhanbryde at an average of £236,193.
What locations have the most affordable properties for sale in Elgin?
The locations with the most affordable properties for sale in Elgin are Elgin City North at an average of £172,267 and Elgin City South at an average of £180,507.
Which train stations are available in or near Elgin?
Some of the train stations available in or near Elgin are Elgin, Forres and Keith.
Property Price Paid in Elgin by Year
The average sold property price by year was:
| Year | Average Sold Price | Price Change |
Sold Properties
|
|---|---|---|---|
| 2023 | £214,735 | 5% |
108 Properties |
| 2022 | £204,947 | 7% |
637 Properties |
| 2021 | £189,907 | 1% |
709 Properties |
| 2020 | £187,785 | 6% |
535 Properties |
| 2019 | £177,056 | 1% |
626 Properties |
| 2018 | £175,221 | 7% |
684 Properties |
| 2017 | £163,040 | 3% |
616 Properties |
| 2016 | £158,714 | 1% |
734 Properties |
| 2015 | £156,419 | 2% |
695 Properties |
| 2014 | £152,808 | 3% |
685 Properties |
| 2013 | £147,851 | -2% |
570 Properties |
| 2012 | £151,334 | 2% |
530 Properties |
| 2011 | £147,789 | -7% |
414 Properties |
| 2010 | £158,455 | 4% |
423 Properties |
| 2009 | £152,352 | 2% |
539 Properties |
| 2008 | £149,124 | 4% |
635 Properties |
| 2007 | £143,235 | 17% |
621 Properties |
| 2006 | £118,196 | 7% |
729 Properties |
| 2005 | £109,998 | 11% |
827 Properties |
| 2004 | £98,045 | -4% |
849 Properties |
| 2003 | £102,060 | 33% |
532 Properties |
| 2002 | £68,530 | 15% |
182 Properties |
| 2001 | £57,995 | -27% |
111 Properties |
| 2000 | £73,585 | - |
26 Properties |