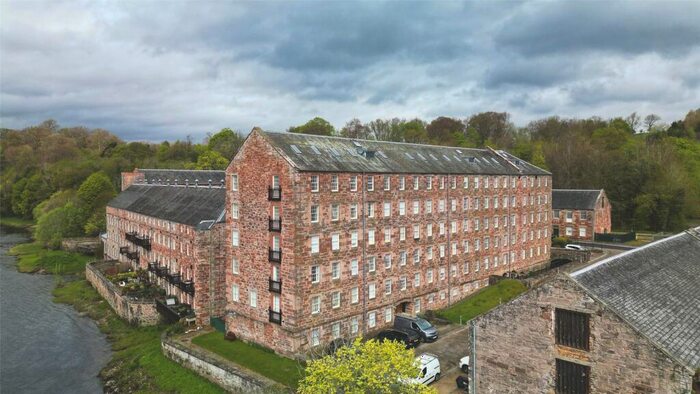
Houses for sale & to rent in Perth, Perth and Kinross
House Prices in Perth
Properties in Perth have an average house price of £209,210.00 and had 3,541 Property Transactions within the last 3 years.¹
Perth is an area in Perth and Kinross with 35,677 households², where the most expensive property was sold for £2,015,000.00.
Properties for sale in Perth
Neighbourhoods in Perth
Navigate through our locations to find the location of your next house in Perth, Perth and Kinross for sale or to rent.
Transport in Perth
Please see below transportation links in this area:
- FAQ
- Price Paid By Year
Frequently asked questions about Perth
What is the average price for a property for sale in Perth?
The average price for a property for sale in Perth is £209,210. This amount is 13% lower than the average price in Perth and Kinross. There are more than 10,000 property listings for sale in Perth.
What locations have the most expensive properties for sale in Perth?
The locations with the most expensive properties for sale in Perth are Strathearn at an average of £400,000, Strathallan at an average of £306,935 and Almond and Earn at an average of £288,944.
What locations have the most affordable properties for sale in Perth?
The locations with the most affordable properties for sale in Perth are Perth City Centre at an average of £145,386, Perth City North at an average of £153,875 and Perth City South at an average of £208,804.
Which train stations are available in or near Perth?
Some of the train stations available in or near Perth are Perth, Dunkeld and Birnam and Gleneagles.
Property Price Paid in Perth by Year
The average sold property price by year was:
| Year | Average Sold Price | Price Change |
Sold Properties
|
|---|---|---|---|
| 2023 | £212,792 | 0,3% |
251 Properties |
| 2022 | £212,231 | 3% |
1,452 Properties |
| 2021 | £206,334 | 5% |
1,838 Properties |
| 2020 | £197,009 | 4% |
1,295 Properties |
| 2019 | £188,672 | 5% |
1,608 Properties |
| 2018 | £179,575 | 1% |
1,527 Properties |
| 2017 | £178,155 | 5% |
1,553 Properties |
| 2016 | £170,103 | -3% |
1,517 Properties |
| 2015 | £175,580 | 4% |
1,470 Properties |
| 2014 | £168,768 | 4% |
1,385 Properties |
| 2013 | £162,280 | -3% |
1,181 Properties |
| 2012 | £166,631 | 2% |
1,018 Properties |
| 2011 | £162,670 | -1% |
926 Properties |
| 2010 | £164,312 | 8% |
1,072 Properties |
| 2009 | £150,607 | -4% |
1,041 Properties |
| 2008 | £156,005 | -3% |
1,464 Properties |
| 2007 | £160,457 | 10% |
1,528 Properties |
| 2006 | £144,250 | 14% |
2,044 Properties |
| 2005 | £123,646 | 8% |
2,033 Properties |
| 2004 | £114,358 | 20% |
2,019 Properties |
| 2003 | £90,921 | 2% |
2,364 Properties |
| 2002 | £88,656 | -44% |
2,271 Properties |
| 2001 | £127,398 | - |
175 Properties |


