
Houses for sale & to rent in Stirling, Stirling
House Prices in Stirling
Properties in Stirling have an average house price of £215,994.00 and had 2,594 Property Transactions within the last 3 years.¹
Stirling is an area in Stirling with 26,466 households², where the most expensive property was sold for £2,101,000.00.
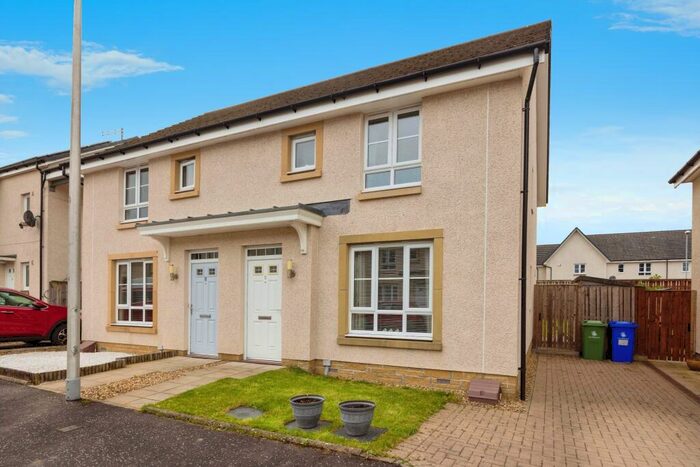
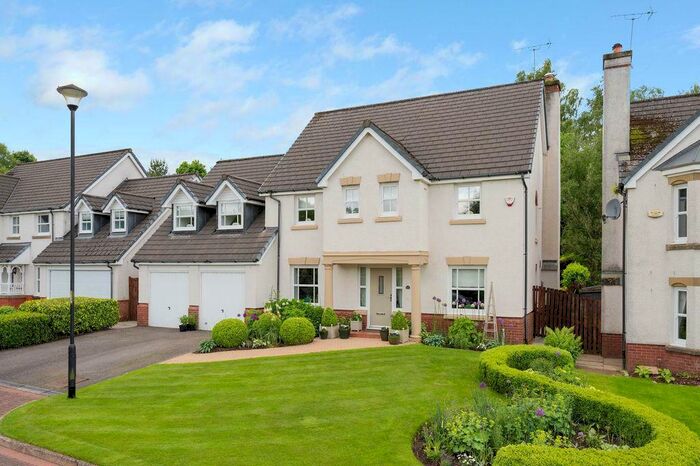
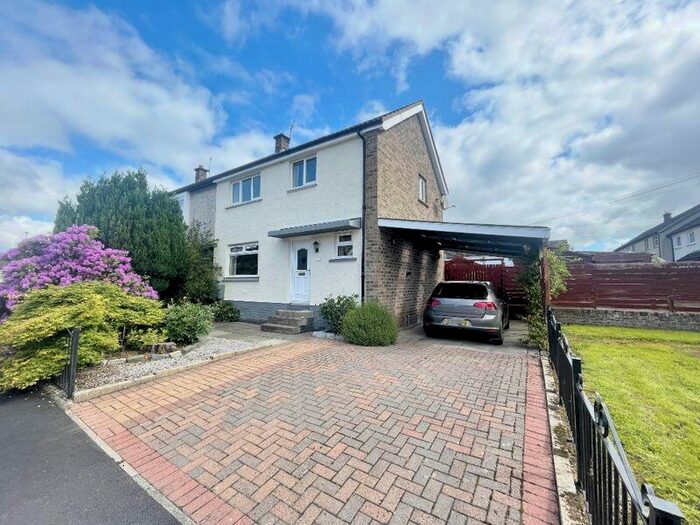
Properties for sale in Stirling


Neighbourhoods in Stirling
Navigate through our locations to find the location of your next house in Stirling, Stirling for sale or to rent.
Transport in Stirling
Please see below transportation links in this area:

- FAQ
- Price Paid By Year
Frequently asked questions about Stirling
What is the average price for a property for sale in Stirling?
The average price for a property for sale in Stirling is £215,994. This amount is 14% lower than the average price in Stirling. There are more than 10,000 property listings for sale in Stirling.
What locations have the most expensive properties for sale in Stirling?
The locations with the most expensive properties for sale in Stirling are Forth and Endrick at an average of £350,668, Trossachs and Teith at an average of £346,278 and Dunblane and Bridge of Allan at an average of £319,770.
What locations have the most affordable properties for sale in Stirling?
The locations with the most affordable properties for sale in Stirling are Stirling East at an average of £155,637, Bannockburn at an average of £175,838 and Stirling North at an average of £177,260.
Which train stations are available in or near Stirling?
Some of the train stations available in or near Stirling are Stirling, Bridge Of Allan and Dunblane.
Property Price Paid in Stirling by Year
The average sold property price by year was:
| Year | Average Sold Price | Price Change |
Sold Properties
|
|---|---|---|---|
| 2023 | £206,096 | -7% |
225 Properties |
| 2022 | £221,246 | 4% |
1,164 Properties |
| 2021 | £212,768 | 5% |
1,205 Properties |
| 2020 | £202,754 | 8% |
946 Properties |
| 2019 | £186,582 | 2% |
1,125 Properties |
| 2018 | £182,842 | 3% |
1,172 Properties |
| 2017 | £176,593 | 3% |
1,186 Properties |
| 2016 | £170,420 | 1% |
1,176 Properties |
| 2015 | £168,666 | 2% |
1,181 Properties |
| 2014 | £165,456 | 4% |
1,048 Properties |
| 2013 | £158,267 | -1% |
935 Properties |
| 2012 | £160,274 | -1% |
795 Properties |
| 2011 | £161,731 | -1% |
780 Properties |
| 2010 | £163,240 | 1% |
865 Properties |
| 2009 | £161,531 | -9% |
817 Properties |
| 2008 | £175,695 | 6% |
1,046 Properties |
| 2007 | £165,867 | 4% |
1,236 Properties |
| 2006 | £158,805 | 12% |
1,475 Properties |
| 2005 | £139,930 | 12% |
1,592 Properties |
| 2004 | £123,194 | 13% |
1,543 Properties |
| 2003 | £107,087 | 15% |
1,567 Properties |
| 2002 | £90,561 | 19% |
1,685 Properties |
| 2001 | £73,270 | - |
128 Properties |