
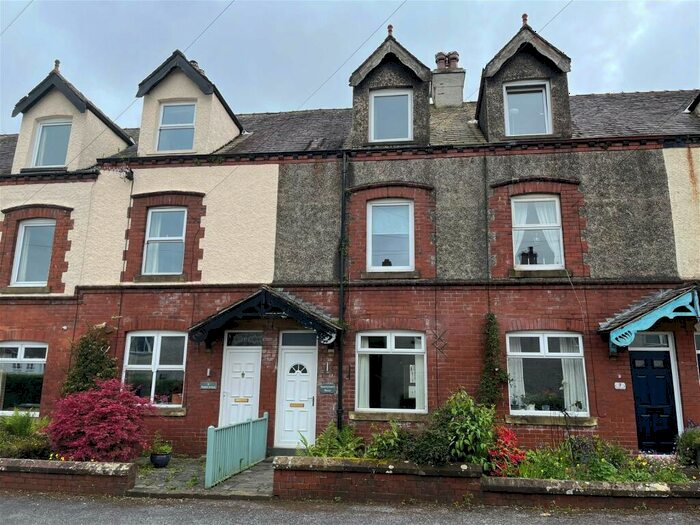
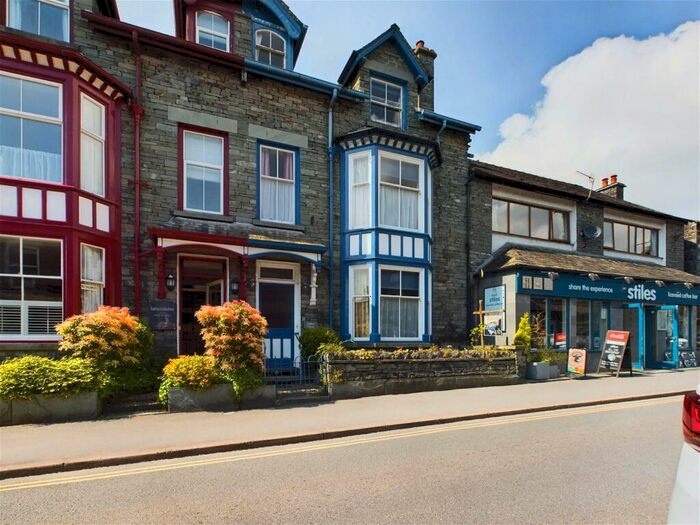
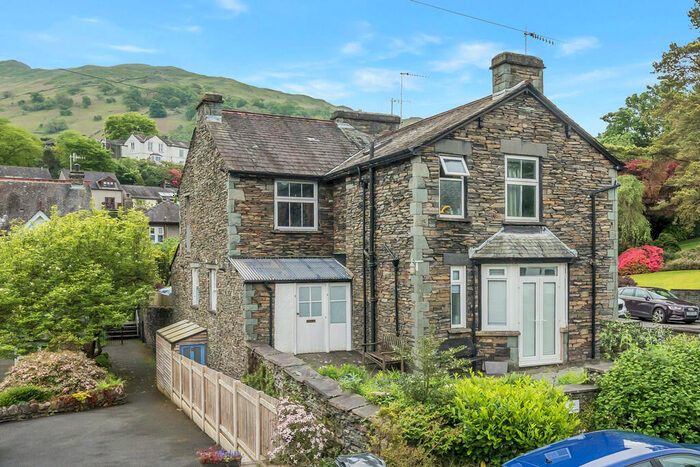
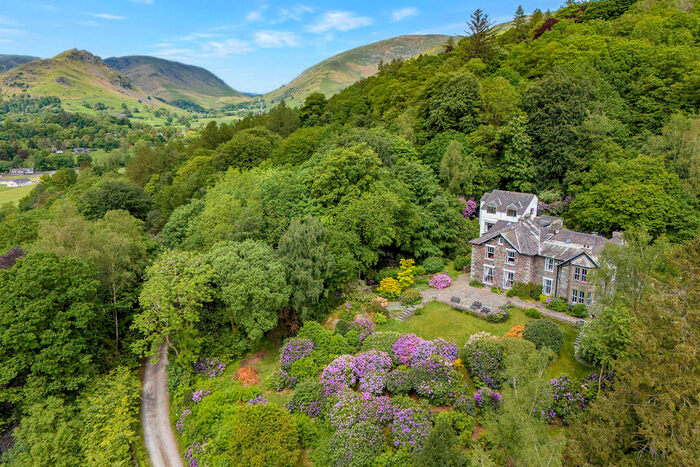
Houses for sale & to rent in Ambleside, Cumbria
House Prices in Ambleside
Properties in Ambleside have an average house price of £569,523.00 and had 288 Property Transactions within the last 3 years.¹
Ambleside is an area in Cumbria with 2,258 households², where the most expensive property was sold for £3,450,000.00.
Properties for sale in Ambleside


Neighbourhoods in Ambleside
Navigate through our locations to find the location of your next house in Ambleside, Cumbria for sale or to rent.
Transport in Ambleside
Please see below transportation links in this area:
-
 Windermere Station
 -
Staveley (Cumbria) Station
-
Burneside Station
-
Kendal Station
-
Oxenholme Lake District Station
-
Foxfield Station
- FAQ
- Price Paid By Year
- Property Type Price
Frequently asked questions about Ambleside
What is the average price for a property for sale in Ambleside?
The average price for a property for sale in Ambleside is £569,523. This amount is 89% higher than the average price in Cumbria. There are 672 property listings for sale in Ambleside.
What locations have the most expensive properties for sale in Ambleside?
The locations with the most expensive properties for sale in Ambleside are Coniston And Crake Valley at an average of £980,875, Broughton & Coniston at an average of £935,875 and Ambleside & Grasmere at an average of £812,000.
What locations have the most affordable properties for sale in Ambleside?
The locations with the most affordable properties for sale in Ambleside are Ambleside And Grasmere at an average of £541,309 and Hawkshead at an average of £590,012.
Which train stations are available in or near Ambleside?
Some of the train stations available in or near Ambleside are Windermere, Staveley (Cumbria) and Burneside.
Property Price Paid in Ambleside by Year
The average sold property price by year was:
| Year | Average Sold Price | Price Change |
Sold Properties
|
|---|---|---|---|
| 2024 | £510,000 | -4% |
3 Properties |
| 2023 | £530,808 | -15% |
62 Properties |
| 2022 | £609,254 | 9% |
106 Properties |
| 2021 | £555,569 | 13% |
117 Properties |
| 2020 | £481,883 | 13% |
95 Properties |
| 2019 | £419,892 | 4% |
101 Properties |
| 2018 | £404,576 | -3% |
96 Properties |
| 2017 | £416,008 | 11% |
112 Properties |
| 2016 | £371,038 | -4% |
123 Properties |
| 2015 | £384,795 | 2% |
141 Properties |
| 2014 | £378,299 | 2% |
122 Properties |
| 2013 | £371,424 | 5% |
123 Properties |
| 2012 | £354,560 | -0,4% |
81 Properties |
| 2011 | £355,906 | -7% |
83 Properties |
| 2010 | £379,872 | 14% |
124 Properties |
| 2009 | £325,923 | -12% |
93 Properties |
| 2008 | £364,063 | 1% |
89 Properties |
| 2007 | £361,909 | 9% |
142 Properties |
| 2006 | £328,657 | 9% |
139 Properties |
| 2005 | £298,210 | 8% |
123 Properties |
| 2004 | £275,245 | 10% |
146 Properties |
| 2003 | £246,570 | 24% |
151 Properties |
| 2002 | £186,812 | 6% |
158 Properties |
| 2001 | £176,535 | 21% |
125 Properties |
| 2000 | £140,128 | 11% |
138 Properties |
| 1999 | £125,343 | 9% |
138 Properties |
| 1998 | £114,392 | 2% |
154 Properties |
| 1997 | £111,643 | 16% |
140 Properties |
| 1996 | £93,892 | 5% |
135 Properties |
| 1995 | £89,176 | - |
75 Properties |
Property Price per Property Type in Ambleside
Here you can find historic sold price data in order to help with your property search.
The average Property Paid Price for specific property types in the last three years are:
| Property Type | Average Sold Price | Sold Properties |
|---|---|---|
| Semi Detached House | £570,609.00 | 46 Semi Detached Houses |
| Terraced House | £440,005.00 | 83 Terraced Houses |
| Detached House | £828,444.00 | 94 Detached Houses |
| Flat | £359,701.00 | 65 Flats |