
Houses for sale & to rent in Keswick, Cumbria
House Prices in Keswick
Properties in Keswick have an average house price of £415,054.00 and had 462 Property Transactions within the last 3 years.¹
Keswick is an area in Cumbria with 3,540 households², where the most expensive property was sold for £1,800,000.00.
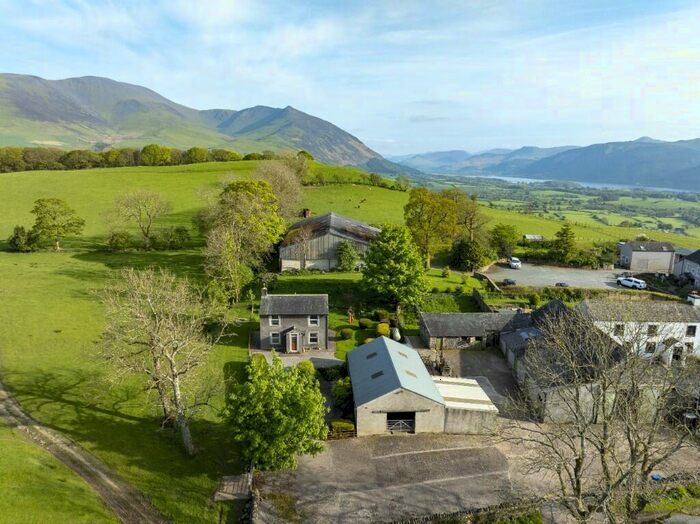
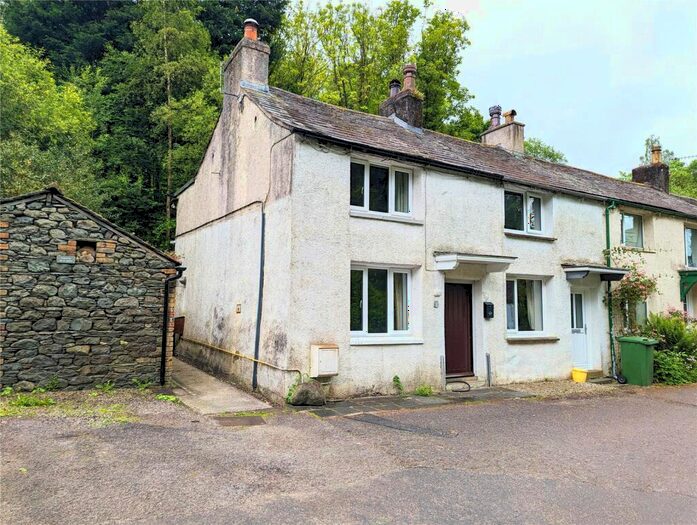
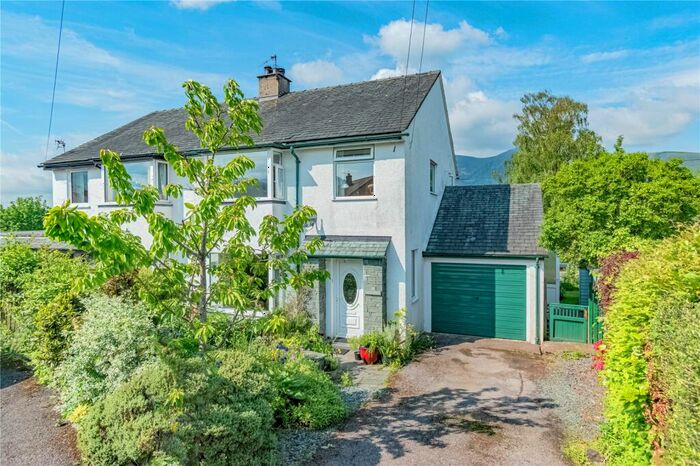
Properties for sale in Keswick


Neighbourhoods in Keswick
Navigate through our locations to find the location of your next house in Keswick, Cumbria for sale or to rent.
Transport in Keswick
Please see below transportation links in this area:
-
 Aspatria Station
 -
Penrith Station
-
Wigton Station
-
Maryport Station
-
Flimby Station
-
Workington Station
-
Harrington Station
-
Dalston Station
-
Parton Station
-
Windermere Station
- FAQ
- Price Paid By Year
- Property Type Price
Frequently asked questions about Keswick
What is the average price for a property for sale in Keswick?
The average price for a property for sale in Keswick is £415,054. This amount is 62% higher than the average price in Cumbria. There are 697 property listings for sale in Keswick.
What locations have the most expensive properties for sale in Keswick?
The locations with the most expensive properties for sale in Keswick are Derwent Valley at an average of £568,131 and Boltons at an average of £488,360.
What locations have the most affordable properties for sale in Keswick?
The locations with the most affordable properties for sale in Keswick are Greystoke at an average of £376,048 and Keswick at an average of £376,446.
Which train stations are available in or near Keswick?
Some of the train stations available in or near Keswick are Aspatria, Penrith and Wigton.
Property Price Paid in Keswick by Year
The average sold property price by year was:
| Year | Average Sold Price | Price Change |
Sold Properties
|
|---|---|---|---|
| 2024 | £382,142 | -14% |
7 Properties |
| 2023 | £433,762 | 0,4% |
105 Properties |
| 2022 | £432,022 | 9% |
151 Properties |
| 2021 | £393,465 | 5% |
199 Properties |
| 2020 | £375,238 | 4% |
148 Properties |
| 2019 | £359,336 | 8% |
167 Properties |
| 2018 | £329,937 | 2% |
166 Properties |
| 2017 | £324,394 | 7% |
184 Properties |
| 2016 | £301,929 | 2% |
161 Properties |
| 2015 | £296,521 | -2% |
164 Properties |
| 2014 | £303,313 | 4% |
158 Properties |
| 2013 | £292,007 | -3% |
121 Properties |
| 2012 | £302,200 | 4% |
98 Properties |
| 2011 | £289,770 | 0,5% |
117 Properties |
| 2010 | £288,369 | 0,2% |
112 Properties |
| 2009 | £287,898 | -8% |
123 Properties |
| 2008 | £311,280 | 6% |
122 Properties |
| 2007 | £293,656 | 4% |
208 Properties |
| 2006 | £282,363 | 7% |
215 Properties |
| 2005 | £262,805 | 4% |
188 Properties |
| 2004 | £251,876 | 18% |
206 Properties |
| 2003 | £205,736 | 13% |
210 Properties |
| 2002 | £179,870 | 25% |
208 Properties |
| 2001 | £135,797 | 3% |
197 Properties |
| 2000 | £131,926 | 15% |
192 Properties |
| 1999 | £112,043 | 9% |
226 Properties |
| 1998 | £101,531 | 5% |
202 Properties |
| 1997 | £96,428 | 12% |
197 Properties |
| 1996 | £85,131 | 0,3% |
196 Properties |
| 1995 | £84,862 | - |
166 Properties |
Property Price per Property Type in Keswick
Here you can find historic sold price data in order to help with your property search.
The average Property Paid Price for specific property types in the last three years are:
| Property Type | Average Sold Price | Sold Properties |
|---|---|---|
| Semi Detached House | £396,043.00 | 93 Semi Detached Houses |
| Terraced House | £368,465.00 | 146 Terraced Houses |
| Detached House | £632,841.00 | 123 Detached Houses |
| Flat | £232,876.00 | 100 Flats |