
Houses for sale & to rent in Exmouth, Devon
House Prices in Exmouth
Properties in Exmouth have an average house price of £352,411.00 and had 2,200 Property Transactions within the last 3 years.¹
Exmouth is an area in Devon with 16,304 households², where the most expensive property was sold for £3,100,000.00.
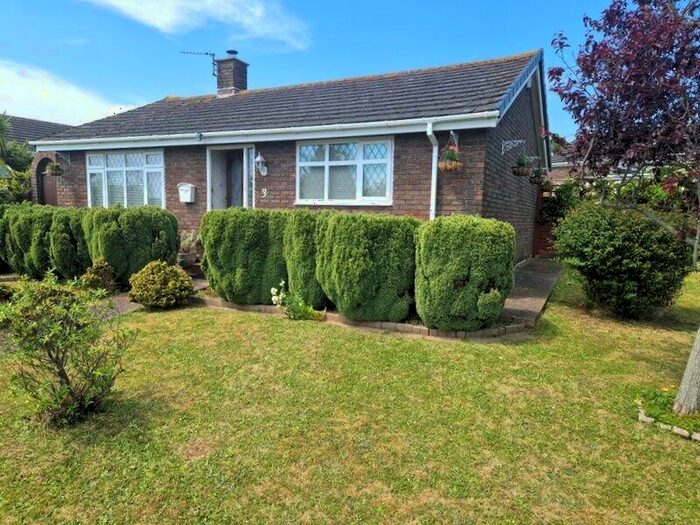
Properties for sale in Exmouth


Neighbourhoods in Exmouth
Navigate through our locations to find the location of your next house in Exmouth, Devon for sale or to rent.
Transport in Exmouth
Please see below transportation links in this area:
-
 Exmouth Station
 -
Lympstone Village Station
-
Starcross Station
-
Lympstone Commando Station
-
Dawlish Warren Station
- FAQ
- Price Paid By Year
- Property Type Price
Frequently asked questions about Exmouth
What is the average price for a property for sale in Exmouth?
The average price for a property for sale in Exmouth is £352,411. This amount is 2% lower than the average price in Devon. There are 4,145 property listings for sale in Exmouth.
What locations have the most expensive properties for sale in Exmouth?
The locations with the most expensive properties for sale in Exmouth are Woodbury And Lympstone at an average of £642,456, Woodbury & Lympstone at an average of £461,071 and Exmouth Littleham at an average of £383,029.
What locations have the most affordable properties for sale in Exmouth?
The locations with the most affordable properties for sale in Exmouth are Exmouth Town at an average of £261,475, Exmouth Withycombe Raleigh at an average of £307,941 and Exmouth Brixington at an average of £368,707.
Which train stations are available in or near Exmouth?
Some of the train stations available in or near Exmouth are Exmouth, Lympstone Village and Starcross.
Property Price Paid in Exmouth by Year
The average sold property price by year was:
| Year | Average Sold Price | Price Change |
Sold Properties
|
|---|---|---|---|
| 2024 | £372,289 | -2% |
42 Properties |
| 2023 | £381,176 | 3% |
464 Properties |
| 2022 | £370,813 | 13% |
761 Properties |
| 2021 | £322,201 | 3% |
933 Properties |
| 2020 | £311,744 | 7% |
742 Properties |
| 2019 | £290,233 | 0,5% |
769 Properties |
| 2018 | £288,809 | 8% |
746 Properties |
| 2017 | £264,957 | 5% |
823 Properties |
| 2016 | £251,561 | 2% |
869 Properties |
| 2015 | £246,328 | 1% |
816 Properties |
| 2014 | £242,998 | 9% |
857 Properties |
| 2013 | £221,166 | -5% |
737 Properties |
| 2012 | £231,378 | -1% |
702 Properties |
| 2011 | £233,863 | 6% |
646 Properties |
| 2010 | £219,221 | 4% |
692 Properties |
| 2009 | £210,724 | -1% |
692 Properties |
| 2008 | £212,819 | -3% |
602 Properties |
| 2007 | £219,586 | 10% |
1,119 Properties |
| 2006 | £198,620 | 5% |
1,135 Properties |
| 2005 | £189,103 | 3% |
829 Properties |
| 2004 | £183,698 | 9% |
1,100 Properties |
| 2003 | £167,022 | 16% |
1,100 Properties |
| 2002 | £140,426 | 23% |
1,295 Properties |
| 2001 | £108,130 | 15% |
1,222 Properties |
| 2000 | £91,637 | 13% |
969 Properties |
| 1999 | £79,941 | 6% |
978 Properties |
| 1998 | £74,956 | 13% |
854 Properties |
| 1997 | £65,326 | 4% |
975 Properties |
| 1996 | £62,932 | 5% |
857 Properties |
| 1995 | £60,034 | - |
618 Properties |
Property Price per Property Type in Exmouth
Here you can find historic sold price data in order to help with your property search.
The average Property Paid Price for specific property types in the last three years are:
| Property Type | Average Sold Price | Sold Properties |
|---|---|---|
| Terraced House | £293,181.00 | 527 Terraced Houses |
| Flat | £237,932.00 | 625 Flats |
| Semi Detached House | £353,131.00 | 449 Semi Detached Houses |
| Detached House | £523,429.00 | 599 Detached Houses |