
Houses for sale & to rent in Ottery St Mary, Devon
House Prices in Ottery St Mary
Properties in Ottery St Mary have an average house price of £463,364.00 and had 493 Property Transactions within the last 3 years.¹
Ottery St Mary is an area in Devon with 3,400 households², where the most expensive property was sold for £2,640,000.00.
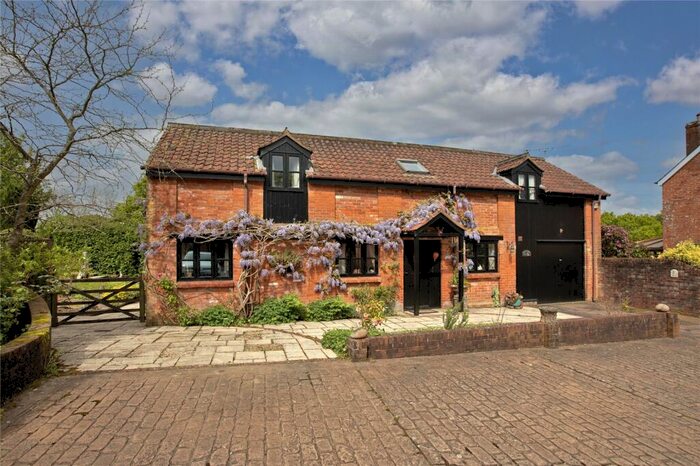
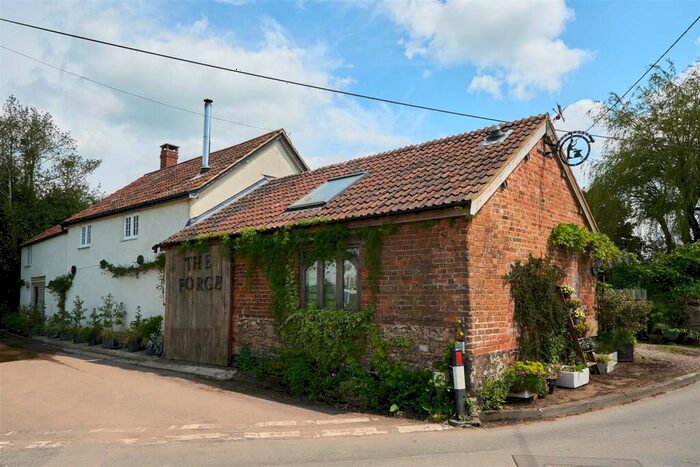
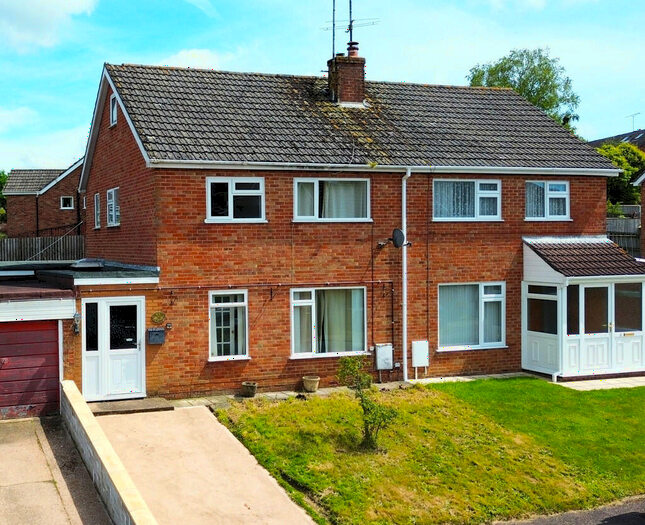
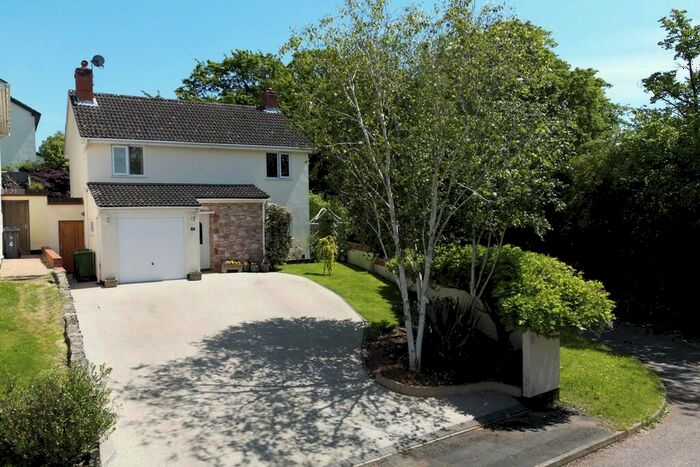
Properties for sale in Ottery St Mary


Neighbourhoods in Ottery St Mary
Navigate through our locations to find the location of your next house in Ottery St Mary, Devon for sale or to rent.
Transport in Ottery St Mary
Please see below transportation links in this area:
-
 Feniton Station
 -
Whimple Station
-
Honiton Station
-
Cranbrook Station
-
Pinhoe Station
-
Digby and Sowton Station
-
Newcourt Station
-
Exton Station
-
Topsham Station
-
Lympstone Commando Station
- FAQ
- Price Paid By Year
- Property Type Price
Frequently asked questions about Ottery St Mary
What is the average price for a property for sale in Ottery St Mary?
The average price for a property for sale in Ottery St Mary is £463,364. This amount is 25% higher than the average price in Devon. There are 2,734 property listings for sale in Ottery St Mary.
What locations have the most expensive properties for sale in Ottery St Mary?
The locations with the most expensive properties for sale in Ottery St Mary are Newton Poppleford And Harpford at an average of £757,187, Ottery St Mary Rural at an average of £730,479 and West Hill & Aylesbeare at an average of £549,750.
What locations have the most affordable properties for sale in Ottery St Mary?
The locations with the most affordable properties for sale in Ottery St Mary are Ottery St Mary Town at an average of £342,254 and Ottery St Mary at an average of £380,217.
Which train stations are available in or near Ottery St Mary?
Some of the train stations available in or near Ottery St Mary are Feniton, Whimple and Honiton.
Property Price Paid in Ottery St Mary by Year
The average sold property price by year was:
| Year | Average Sold Price | Price Change |
Sold Properties
|
|---|---|---|---|
| 2024 | £471,250 | -5% |
12 Properties |
| 2023 | £493,103 | -1% |
113 Properties |
| 2022 | £500,033 | 14% |
133 Properties |
| 2021 | £427,908 | 15% |
235 Properties |
| 2020 | £363,931 | -1% |
160 Properties |
| 2019 | £368,441 | -6% |
222 Properties |
| 2018 | £391,534 | 6% |
225 Properties |
| 2017 | £369,369 | 5% |
211 Properties |
| 2016 | £350,401 | 12% |
209 Properties |
| 2015 | £309,696 | -5% |
174 Properties |
| 2014 | £326,460 | 6% |
173 Properties |
| 2013 | £305,585 | 5% |
133 Properties |
| 2012 | £289,255 | -1% |
146 Properties |
| 2011 | £291,535 | -10% |
130 Properties |
| 2010 | £322,079 | 7% |
130 Properties |
| 2009 | £301,030 | -7% |
126 Properties |
| 2008 | £321,104 | 2% |
110 Properties |
| 2007 | £314,349 | 15% |
182 Properties |
| 2006 | £265,885 | 7% |
200 Properties |
| 2005 | £246,726 | -11% |
187 Properties |
| 2004 | £274,302 | 22% |
206 Properties |
| 2003 | £212,796 | 18% |
238 Properties |
| 2002 | £173,462 | 9% |
245 Properties |
| 2001 | £158,471 | 12% |
215 Properties |
| 2000 | £139,656 | 25% |
193 Properties |
| 1999 | £104,212 | 13% |
141 Properties |
| 1998 | £91,081 | - |
134 Properties |
| 1997 | £91,126 | 8% |
168 Properties |
| 1996 | £84,276 | 2% |
131 Properties |
| 1995 | £82,931 | - |
108 Properties |
Property Price per Property Type in Ottery St Mary
Here you can find historic sold price data in order to help with your property search.
The average Property Paid Price for specific property types in the last three years are:
| Property Type | Average Sold Price | Sold Properties |
|---|---|---|
| Semi Detached House | £330,628.00 | 107 Semi Detached Houses |
| Terraced House | £248,438.00 | 122 Terraced Houses |
| Detached House | £651,704.00 | 240 Detached Houses |
| Flat | £264,283.00 | 24 Flats |