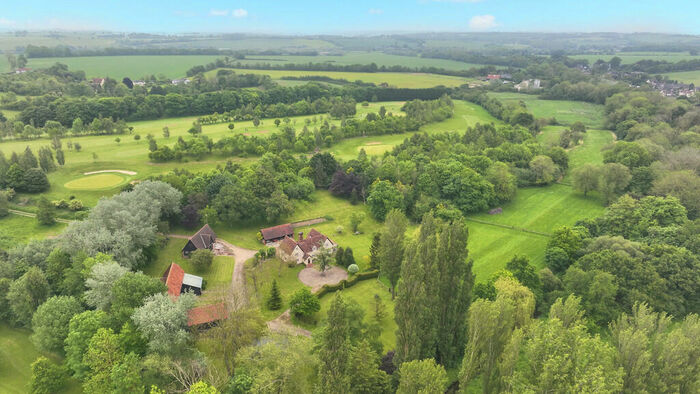
Houses for sale & to rent in Haverhill, Suffolk
House Prices in Haverhill
Properties in Haverhill have an average house price of £285,137.00 and had 1,271 Property Transactions within the last 3 years.¹
Haverhill is an area in Suffolk with 11,981 households², where the most expensive property was sold for £1,250,000.00.
Properties for sale in Haverhill
Neighbourhoods in Haverhill
Navigate through our locations to find the location of your next house in Haverhill, Suffolk for sale or to rent.
Transport in Haverhill
Please see below transportation links in this area:
-
Dullingham Station
-
Newmarket Station
-
Great Chesterford Station
-
Audley End Station
-
Whittlesford Station
-
Newport (Essex) Station
-
Sudbury Station
-
Kennett Station
-
Shelford Station
-
Elsenham Station
- FAQ
- Price Paid By Year
- Property Type Price
Frequently asked questions about Haverhill
What is the average price for a property for sale in Haverhill?
The average price for a property for sale in Haverhill is £285,137. This amount is 12% lower than the average price in Suffolk. There are 1,540 property listings for sale in Haverhill.
What locations have the most expensive properties for sale in Haverhill?
The locations with the most expensive properties for sale in Haverhill are Clare, Hundon & Kedington at an average of £424,750, Withersfield at an average of £410,011 and Kedington at an average of £365,838.
What locations have the most affordable properties for sale in Haverhill?
The locations with the most affordable properties for sale in Haverhill are Haverhill Central at an average of £214,932, Haverhill East at an average of £256,501 and Haverhill South at an average of £259,024.
Which train stations are available in or near Haverhill?
Some of the train stations available in or near Haverhill are Dullingham, Newmarket and Great Chesterford.
Property Price Paid in Haverhill by Year
The average sold property price by year was:
| Year | Average Sold Price | Price Change |
Sold Properties
|
|---|---|---|---|
| 2024 | £315,888 | 5% |
17 Properties |
| 2023 | £301,323 | 2% |
240 Properties |
| 2022 | £294,930 | 9% |
455 Properties |
| 2021 | £269,281 | 5% |
559 Properties |
| 2020 | £257,072 | 0,3% |
435 Properties |
| 2019 | £256,281 | -0,1% |
449 Properties |
| 2018 | £256,566 | 2% |
440 Properties |
| 2017 | £251,164 | 11% |
501 Properties |
| 2016 | £223,387 | 4% |
543 Properties |
| 2015 | £215,561 | 9% |
595 Properties |
| 2014 | £195,778 | 8% |
613 Properties |
| 2013 | £179,628 | 2% |
471 Properties |
| 2012 | £175,473 | 4% |
426 Properties |
| 2011 | £168,336 | 1% |
383 Properties |
| 2010 | £166,447 | 9% |
394 Properties |
| 2009 | £152,131 | -13% |
392 Properties |
| 2008 | £172,233 | -3% |
381 Properties |
| 2007 | £177,533 | 6% |
770 Properties |
| 2006 | £166,107 | 8% |
872 Properties |
| 2005 | £153,604 | 7% |
637 Properties |
| 2004 | £143,435 | 9% |
819 Properties |
| 2003 | £130,273 | 10% |
794 Properties |
| 2002 | £117,877 | 19% |
890 Properties |
| 2001 | £95,514 | 10% |
946 Properties |
| 2000 | £86,132 | 11% |
872 Properties |
| 1999 | £76,237 | 15% |
866 Properties |
| 1998 | £64,502 | 7% |
710 Properties |
| 1997 | £59,667 | 6% |
742 Properties |
| 1996 | £55,936 | 6% |
599 Properties |
| 1995 | £52,315 | - |
386 Properties |
Property Price per Property Type in Haverhill
Here you can find historic sold price data in order to help with your property search.
The average Property Paid Price for specific property types in the last three years are:
| Property Type | Average Sold Price | Sold Properties |
|---|---|---|
| Semi Detached House | £283,018.00 | 313 Semi Detached Houses |
| Terraced House | £227,811.00 | 546 Terraced Houses |
| Detached House | £405,131.00 | 337 Detached Houses |
| Flat | £172,140.00 | 75 Flats |


