
Houses for sale & to rent in Newmarket, Suffolk
House Prices in Newmarket
Properties in Newmarket have an average house price of £338,886.00 and had 1,253 Property Transactions within the last 3 years.¹
Newmarket is an area in Suffolk with 10,661 households², where the most expensive property was sold for £3,500,000.00.
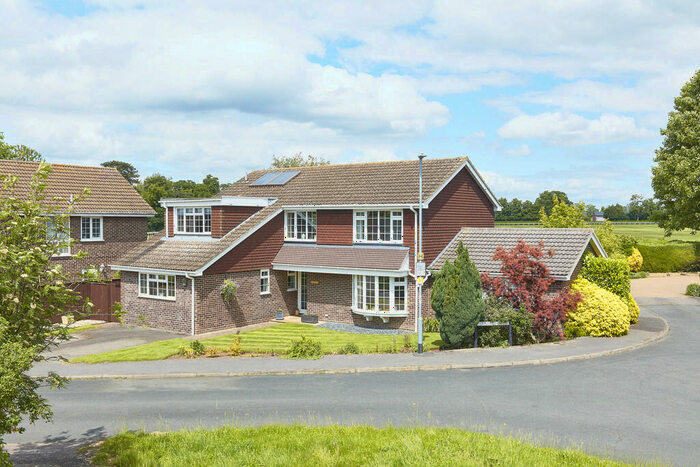
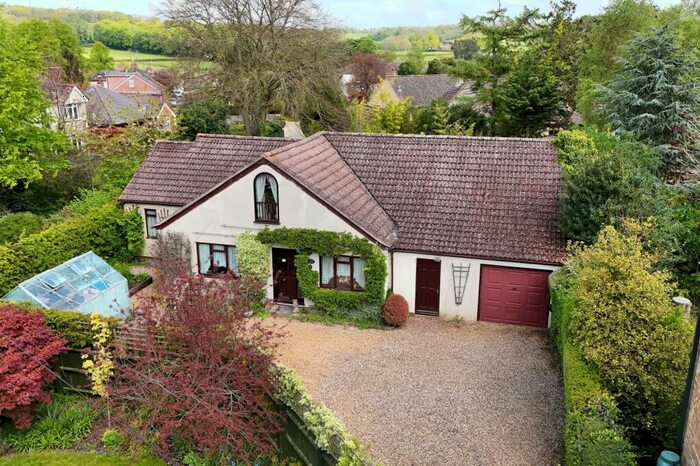
Properties for sale in Newmarket


Neighbourhoods in Newmarket
Navigate through our locations to find the location of your next house in Newmarket, Suffolk for sale or to rent.
Transport in Newmarket
Please see below transportation links in this area:

- FAQ
- Price Paid By Year
- Property Type Price
Frequently asked questions about Newmarket
What is the average price for a property for sale in Newmarket?
The average price for a property for sale in Newmarket is £338,886. This amount is 5% higher than the average price in Suffolk. There are 5,350 property listings for sale in Newmarket.
What locations have the most expensive properties for sale in Newmarket?
The locations with the most expensive properties for sale in Newmarket are Withersfield at an average of £694,833, Cavendish at an average of £656,222 and Red Lodge at an average of £608,500.
What locations have the most affordable properties for sale in Newmarket?
The locations with the most affordable properties for sale in Newmarket are St Marys at an average of £269,848, All Saints at an average of £282,034 and Severals at an average of £286,445.
Which train stations are available in or near Newmarket?
Some of the train stations available in or near Newmarket are Newmarket, Kennett and Dullingham.
Property Price Paid in Newmarket by Year
The average sold property price by year was:
| Year | Average Sold Price | Price Change |
Sold Properties
|
|---|---|---|---|
| 2024 | £336,043 | 1% |
23 Properties |
| 2023 | £333,640 | -7% |
267 Properties |
| 2022 | £356,378 | 9% |
459 Properties |
| 2021 | £325,864 | 6% |
504 Properties |
| 2020 | £307,607 | -1% |
389 Properties |
| 2019 | £310,140 | 1% |
394 Properties |
| 2018 | £308,485 | 1% |
427 Properties |
| 2017 | £305,066 | 6% |
512 Properties |
| 2016 | £287,248 | 7% |
532 Properties |
| 2015 | £268,557 | 12% |
447 Properties |
| 2014 | £236,838 | 5% |
562 Properties |
| 2013 | £226,078 | 3% |
454 Properties |
| 2012 | £220,292 | 9% |
362 Properties |
| 2011 | £200,190 | -3% |
391 Properties |
| 2010 | £205,973 | 11% |
357 Properties |
| 2009 | £182,701 | -24% |
371 Properties |
| 2008 | £226,322 | 3% |
286 Properties |
| 2007 | £219,214 | 8% |
570 Properties |
| 2006 | £202,192 | 1% |
694 Properties |
| 2005 | £199,679 | 6% |
537 Properties |
| 2004 | £188,574 | 15% |
646 Properties |
| 2003 | £160,916 | 4% |
603 Properties |
| 2002 | £154,095 | 21% |
614 Properties |
| 2001 | £121,662 | 17% |
607 Properties |
| 2000 | £100,426 | 14% |
589 Properties |
| 1999 | £85,875 | 10% |
624 Properties |
| 1998 | £77,037 | 3% |
551 Properties |
| 1997 | £74,369 | 13% |
556 Properties |
| 1996 | £64,425 | 0,3% |
493 Properties |
| 1995 | £64,206 | - |
435 Properties |
Property Price per Property Type in Newmarket
Here you can find historic sold price data in order to help with your property search.
The average Property Paid Price for specific property types in the last three years are:
| Property Type | Average Sold Price | Sold Properties |
|---|---|---|
| Semi Detached House | £304,577.00 | 241 Semi Detached Houses |
| Terraced House | £257,244.00 | 481 Terraced Houses |
| Detached House | £534,757.00 | 362 Detached Houses |
| Flat | £200,617.00 | 169 Flats |