
Houses for sale & to rent in Aberdeen, Aberdeen City
House Prices in Aberdeen
Properties in Aberdeen have an average house price of £182,380.00 and had 9,599 Property Transactions within the last 3 years.¹
Aberdeen is an area in Aberdeen City with 99,965 households², where the most expensive property was sold for £1,525,000.00.
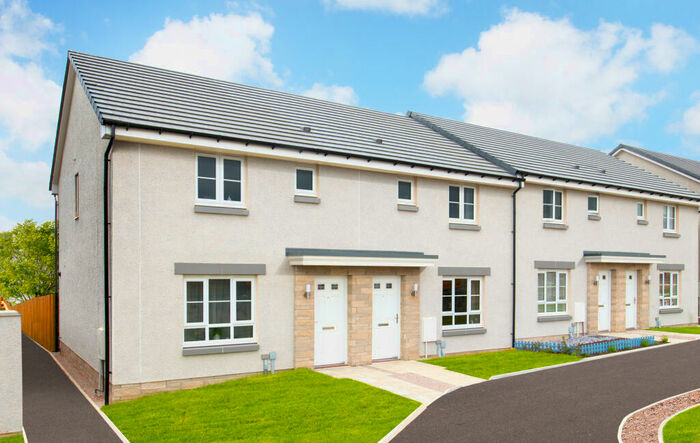
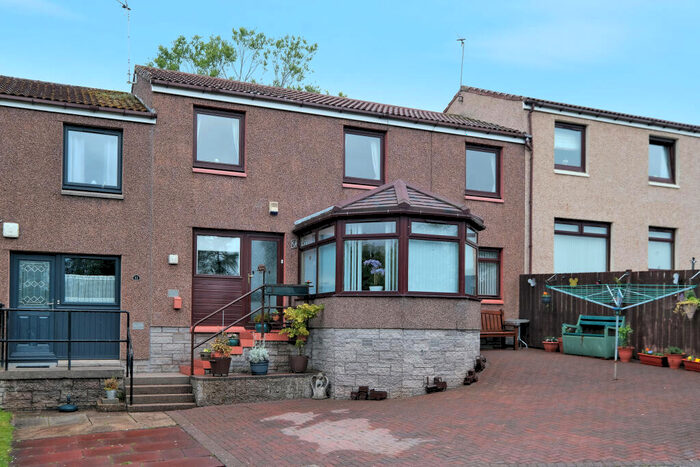
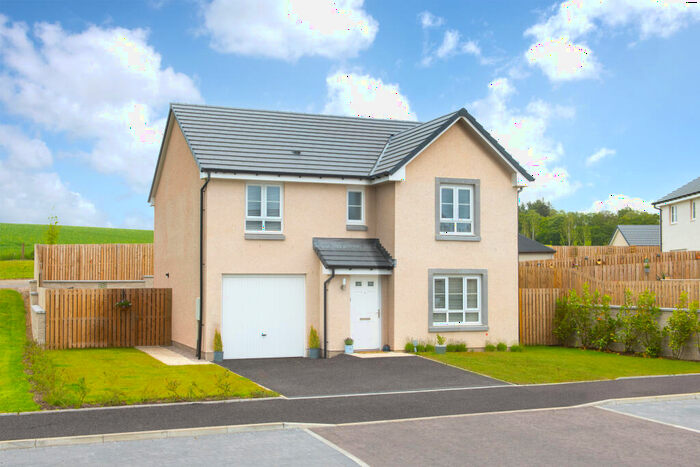
Properties for sale in Aberdeen


Neighbourhoods in Aberdeen
Navigate through our locations to find the location of your next house in Aberdeen, Aberdeen City for sale or to rent.
- George St/Harbour
- Midstocket/Rosemount
- Hazlehead/Queens Cross/Countesswells
- Kincorth/Nigg/Cove
- Torry/Ferryhill
- Airyhall/Broomhill/Garthdee
- Kingswells/Sheddocksley/Summerhill
- Lower Deeside
- Dyce/Bucksburn/Danestone
- Hilton/Woodside/Stockethill
- Northfield/Mastrick North
- Bridge of Don
- Tillydrone/Seaton/Old Aberdeen
Transport in Aberdeen
Please see below transportation links in this area:

- FAQ
- Price Paid By Year
Frequently asked questions about Aberdeen
What is the average price for a property for sale in Aberdeen?
The average price for a property for sale in Aberdeen is £182,380. This amount is 2% lower than the average price in Aberdeen City. There are 3,868 property listings for sale in Aberdeen.
What locations have the most expensive properties for sale in Aberdeen?
The locations with the most expensive properties for sale in Aberdeen are Lower Deeside at an average of £411,338, Hazlehead/Queens Cross/Countesswells at an average of £270,027 and Kingswells/Sheddocksley/Summerhill at an average of £207,876.
What locations have the most affordable properties for sale in Aberdeen?
The locations with the most affordable properties for sale in Aberdeen are George St/Harbour at an average of £96,608, Tillydrone/Seaton/Old Aberdeen at an average of £117,796 and Hilton/Woodside/Stockethill at an average of £125,563.
Which train stations are available in or near Aberdeen?
Some of the train stations available in or near Aberdeen are Aberdeen, Dyce and Portlethen.
Property Price Paid in Aberdeen by Year
The average sold property price by year was:
| Year | Average Sold Price | Price Change |
Sold Properties
|
|---|---|---|---|
| 2023 | £157,584 | -14% |
711 Properties |
| 2022 | £179,292 | -6% |
4,391 Properties |
| 2021 | £189,314 | 3% |
4,497 Properties |
| 2020 | £183,985 | -4% |
3,080 Properties |
| 2019 | £190,928 | -1% |
3,758 Properties |
| 2018 | £192,735 | -2% |
3,700 Properties |
| 2017 | £195,827 | -2% |
3,756 Properties |
| 2016 | £200,703 | -10% |
3,819 Properties |
| 2015 | £220,841 | 3% |
4,838 Properties |
| 2014 | £215,142 | 7% |
5,112 Properties |
| 2013 | £199,248 | 5% |
5,332 Properties |
| 2012 | £189,633 | 1% |
4,462 Properties |
| 2011 | £187,789 | -4% |
3,917 Properties |
| 2010 | £195,812 | 12% |
4,009 Properties |
| 2009 | £171,418 | -6% |
4,099 Properties |
| 2008 | £181,300 | -1% |
4,825 Properties |
| 2007 | £182,328 | -59% |
5,852 Properties |
| 2006 | £289,181 | 59% |
6,659 Properties |
| 2005 | £117,725 | 8% |
7,032 Properties |
| 2004 | £108,457 | 16% |
6,613 Properties |
| 2003 | £91,121 | 6% |
6,463 Properties |
| 2002 | £86,063 | -58% |
6,694 Properties |
| 2001 | £135,816 | 30% |
438 Properties |
| 2000 | £95,000 | - |
1 Property |