
Houses for sale & to rent in Aberdeen, Aberdeenshire
House Prices in Aberdeen
Properties in Aberdeen have an average house price of £239,676.00 and had 947 Property Transactions within the last 3 years.¹
Aberdeen is an area in Aberdeenshire with 8,858 households², where the most expensive property was sold for £800,000.00.
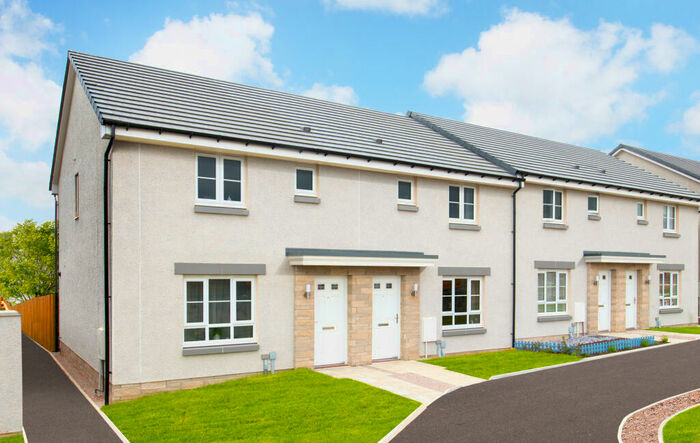
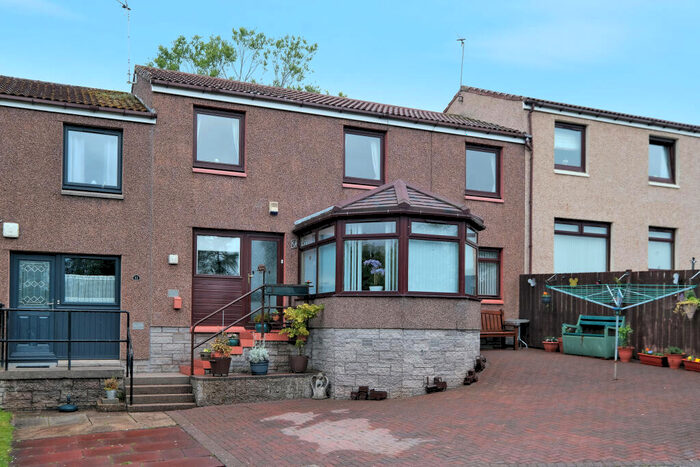
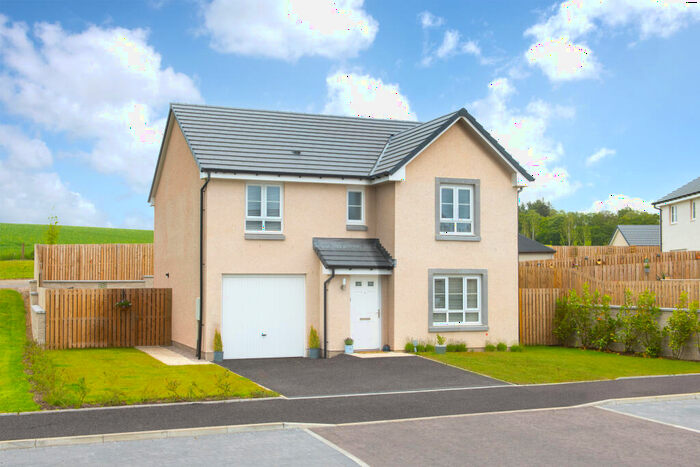
Properties for sale in Aberdeen


Neighbourhoods in Aberdeen
Navigate through our locations to find the location of your next house in Aberdeen, Aberdeenshire for sale or to rent.
Transport in Aberdeen
Please see below transportation links in this area:

- FAQ
- Price Paid By Year
Frequently asked questions about Aberdeen
What is the average price for a property for sale in Aberdeen?
The average price for a property for sale in Aberdeen is £239,676. This amount is 7% higher than the average price in Aberdeenshire. There are 4,219 property listings for sale in Aberdeen.
What locations have the most expensive properties for sale in Aberdeen?
The locations with the most expensive properties for sale in Aberdeen are Ellon and District at an average of £352,862 and East Garioch at an average of £240,770.
What locations have the most affordable properties for sale in Aberdeen?
The locations with the most affordable properties for sale in Aberdeen are Mid Formartine at an average of £232,247 and North Kincardine at an average of £240,607.
Which train stations are available in or near Aberdeen?
Some of the train stations available in or near Aberdeen are Dyce, Aberdeen and Portlethen.
Property Price Paid in Aberdeen by Year
The average sold property price by year was:
| Year | Average Sold Price | Price Change |
Sold Properties
|
|---|---|---|---|
| 2023 | £244,352 | 3% |
62 Properties |
| 2022 | £237,833 | -1% |
393 Properties |
| 2021 | £240,559 | 5% |
492 Properties |
| 2020 | £227,702 | -2% |
318 Properties |
| 2019 | £232,496 | -5% |
384 Properties |
| 2018 | £244,630 | 6% |
386 Properties |
| 2017 | £229,703 | -9% |
386 Properties |
| 2016 | £249,904 | -9% |
334 Properties |
| 2015 | £271,854 | -1% |
462 Properties |
| 2014 | £274,373 | 9% |
692 Properties |
| 2013 | £248,532 | 4% |
678 Properties |
| 2012 | £238,476 | 3% |
530 Properties |
| 2011 | £230,955 | -36% |
488 Properties |
| 2010 | £314,931 | 22% |
391 Properties |
| 2009 | £245,644 | -19% |
456 Properties |
| 2008 | £292,913 | 16% |
407 Properties |
| 2007 | £245,927 | 19% |
497 Properties |
| 2006 | £197,994 | 26% |
512 Properties |
| 2005 | £146,619 | 16% |
563 Properties |
| 2004 | £123,295 | 10% |
507 Properties |
| 2003 | £111,173 | 17% |
557 Properties |
| 2002 | £92,337 | 2% |
662 Properties |
| 2001 | £90,208 | - |
40 Properties |