
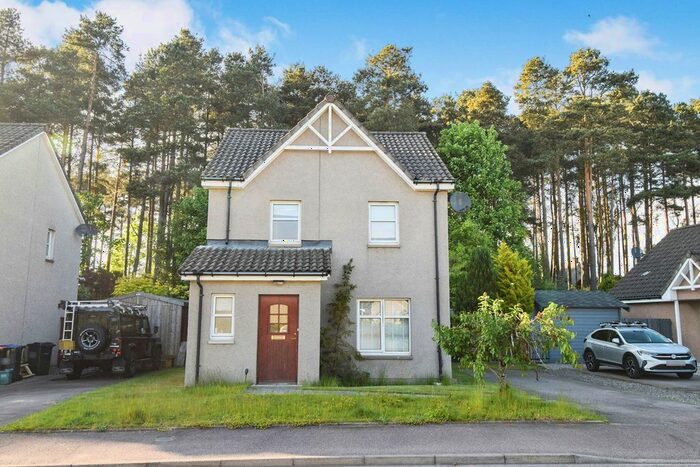
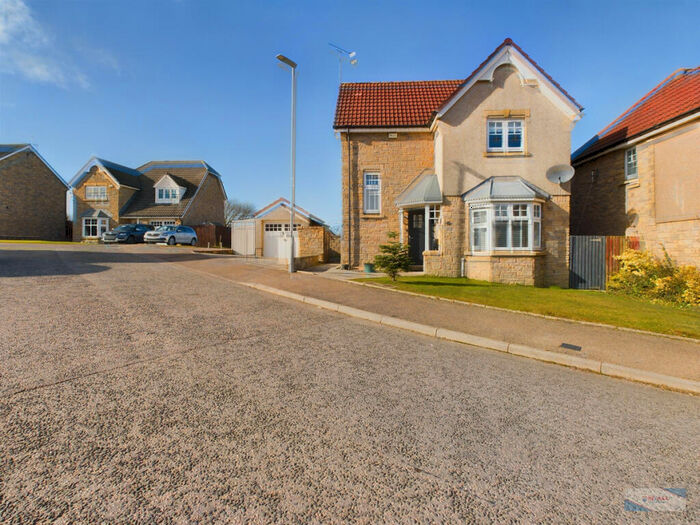
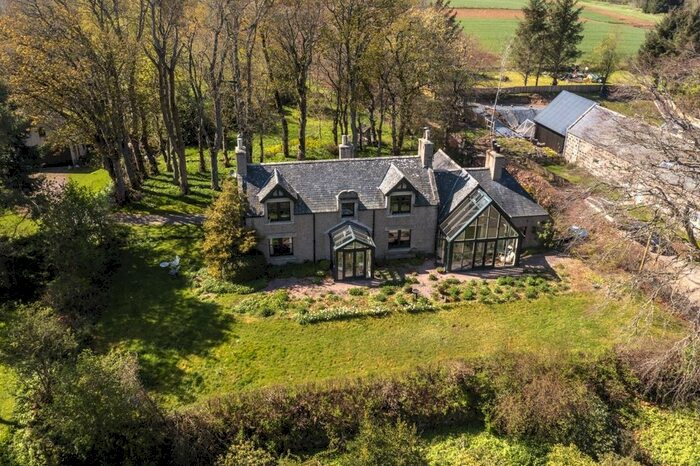
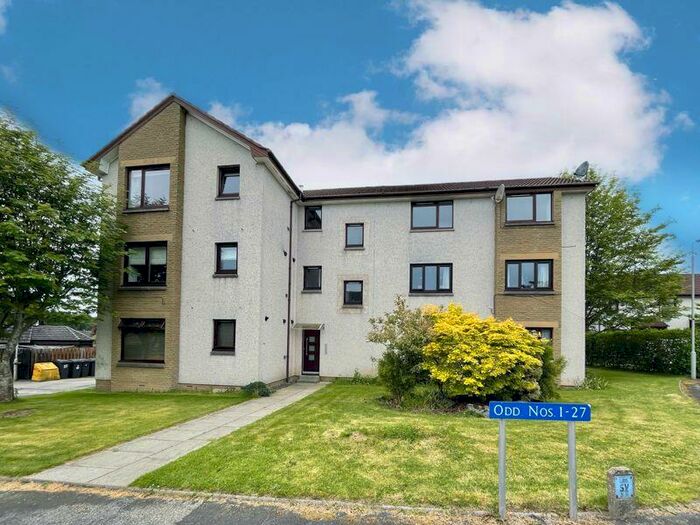
Houses for sale & to rent in Inverurie, Aberdeenshire
House Prices in Inverurie
Properties in Inverurie have an average house price of £246,347.00 and had 1,563 Property Transactions within the last 3 years.¹
Inverurie is an area in Aberdeenshire with 14,150 households², where the most expensive property was sold for £1,150,000.00.
Properties for sale in Inverurie


Neighbourhoods in Inverurie
Navigate through our locations to find the location of your next house in Inverurie, Aberdeenshire for sale or to rent.
Transport in Inverurie
Please see below transportation links in this area:

- FAQ
- Price Paid By Year
Frequently asked questions about Inverurie
What is the average price for a property for sale in Inverurie?
The average price for a property for sale in Inverurie is £246,347. This amount is 10% higher than the average price in Aberdeenshire. There are 1,920 property listings for sale in Inverurie.
What locations have the most expensive properties for sale in Inverurie?
The locations with the most expensive properties for sale in Inverurie are Westhill and District at an average of £358,002, Huntly, Strathbogie and Howe of Alford at an average of £285,715 and Mid Formartine at an average of £275,913.
What locations have the most affordable properties for sale in Inverurie?
The locations with the most affordable properties for sale in Inverurie are Turriff and District at an average of £218,216, Inverurie and District at an average of £227,571 and West Garioch at an average of £240,555.
Which train stations are available in or near Inverurie?
Some of the train stations available in or near Inverurie are Inverurie, Insch and Dyce.
Property Price Paid in Inverurie by Year
The average sold property price by year was:
| Year | Average Sold Price | Price Change |
Sold Properties
|
|---|---|---|---|
| 2023 | £238,761 | -2% |
88 Properties |
| 2022 | £243,332 | -3% |
695 Properties |
| 2021 | £249,889 | 3% |
780 Properties |
| 2020 | £241,934 | 3% |
510 Properties |
| 2019 | £233,915 | -2% |
682 Properties |
| 2018 | £237,768 | -2% |
637 Properties |
| 2017 | £241,731 | 0,4% |
562 Properties |
| 2016 | £240,854 | -11% |
602 Properties |
| 2015 | £267,463 | 4% |
775 Properties |
| 2014 | £256,807 | 7% |
840 Properties |
| 2013 | £239,386 | 4% |
741 Properties |
| 2012 | £230,662 | -0,1% |
682 Properties |
| 2011 | £231,004 | 4% |
574 Properties |
| 2010 | £222,660 | 10% |
632 Properties |
| 2009 | £201,238 | -35% |
642 Properties |
| 2008 | £272,318 | 16% |
531 Properties |
| 2007 | £228,219 | 28% |
627 Properties |
| 2006 | £164,654 | 14% |
716 Properties |
| 2005 | £141,984 | 0,5% |
800 Properties |
| 2004 | £141,295 | 27% |
754 Properties |
| 2003 | £103,770 | -6% |
732 Properties |
| 2002 | £110,483 | 16% |
882 Properties |
| 2001 | £92,548 | - |
44 Properties |