
Houses for sale & to rent in Kirkwall, Orkney Islands
House Prices in Kirkwall
Properties in Kirkwall have an average house price of £191,434.00 and had 295 Property Transactions within the last 3 years.¹
Kirkwall is an area in Orkney Islands with 3,872 households², where the most expensive property was sold for £820,000.00.
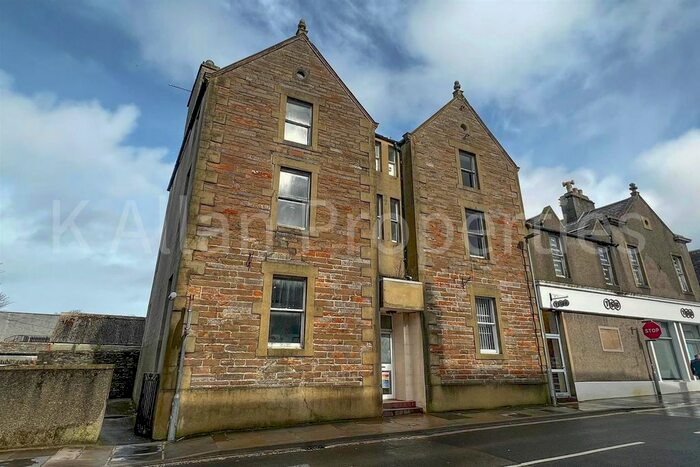
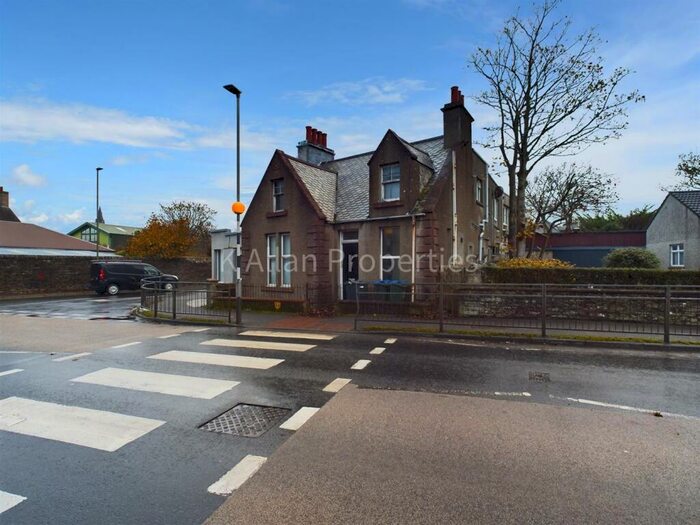
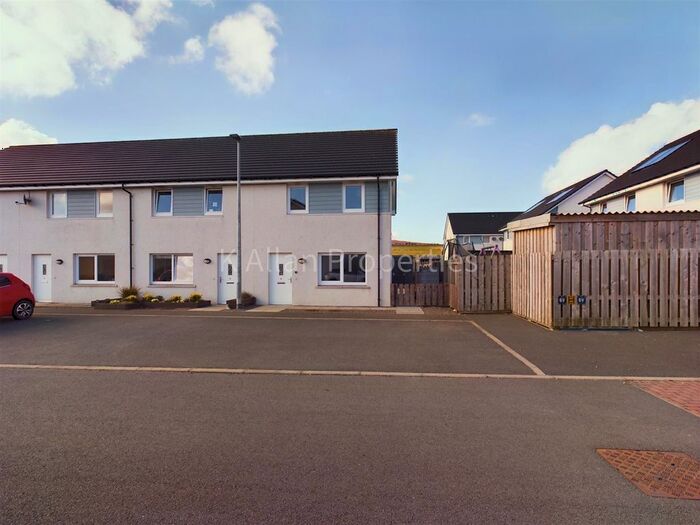
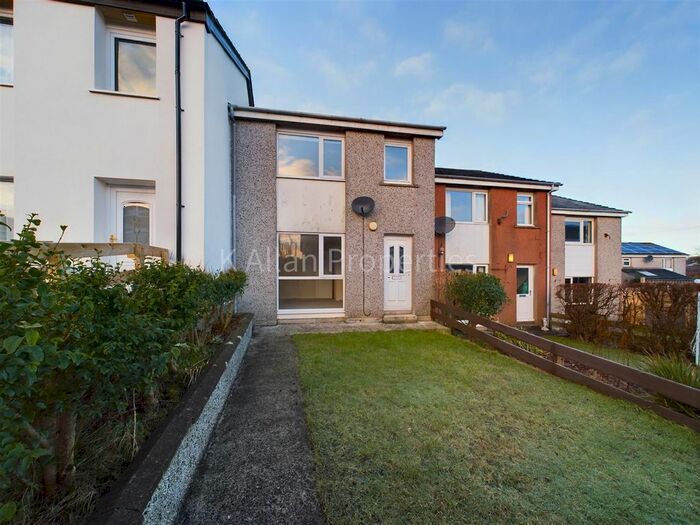
Properties for sale in Kirkwall


Neighbourhoods in Kirkwall
Navigate through our locations to find the location of your next house in Kirkwall, Orkney Islands for sale or to rent.
Transport in Kirkwall
Please see below transportation links in this area:

- FAQ
- Price Paid By Year
Frequently asked questions about Kirkwall
What is the average price for a property for sale in Kirkwall?
The average price for a property for sale in Kirkwall is £191,434. This amount is 3% lower than the average price in Orkney Islands. There are 179 property listings for sale in Kirkwall.
What locations have the most expensive properties for sale in Kirkwall?
The locations with the most expensive properties for sale in Kirkwall are East Mainland, South Ronaldsay and Burray at an average of £225,000 and Kirkwall East at an average of £213,298.
What locations have the most affordable properties for sale in Kirkwall?
The location with the most affordable properties for sale in Kirkwall is Kirkwall West and Orphir at an average of £170,351.
Which train stations are available in or near Kirkwall?
Some of the train stations available in or near Kirkwall are Thurso, Georgemas Junction and Wick.
Property Price Paid in Kirkwall by Year
The average sold property price by year was:
| Year | Average Sold Price | Price Change |
Sold Properties
|
|---|---|---|---|
| 2023 | £214,672 | 10% |
25 Properties |
| 2022 | £193,630 | 4% |
124 Properties |
| 2021 | £185,590 | 14% |
146 Properties |
| 2020 | £159,441 | -2% |
131 Properties |
| 2019 | £163,273 | -1% |
163 Properties |
| 2018 | £164,124 | 11% |
177 Properties |
| 2017 | £146,549 | 3% |
191 Properties |
| 2016 | £142,194 | 8% |
174 Properties |
| 2015 | £131,090 | 4% |
142 Properties |
| 2014 | £126,327 | -3% |
144 Properties |
| 2013 | £129,816 | 6% |
129 Properties |
| 2012 | £121,661 | 1% |
115 Properties |
| 2011 | £120,245 | 12% |
108 Properties |
| 2010 | £106,132 | -11% |
109 Properties |
| 2009 | £118,331 | 6% |
115 Properties |
| 2008 | £111,067 | -5% |
149 Properties |
| 2007 | £116,224 | 10% |
127 Properties |
| 2006 | £104,408 | -7% |
156 Properties |
| 2005 | £111,919 | 28% |
169 Properties |
| 2004 | £80,569 | 32% |
177 Properties |
| 2003 | £55,130 | 11% |
129 Properties |
| 2002 | £49,040 | 11% |
21 Properties |
| 2001 | £43,654 | -13% |
20 Properties |
| 2000 | £49,271 | - |
12 Properties |